
Figure 4.
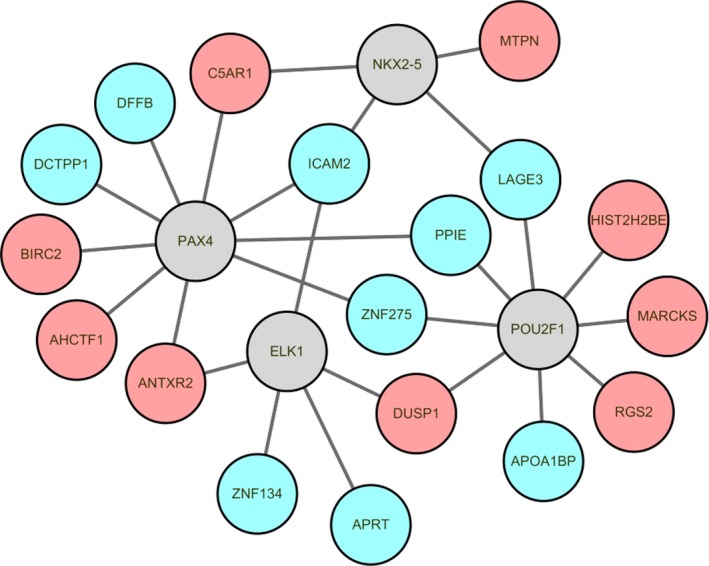
The IS‐specific transcriptional regulatory network. Red‐ and green‐color nodes represent the up‐ and down‐regulated DEGs targeted by TFs, respectively. Gray nodes denote the TFs which predicted to interact with the corresponding DEGs. DEGs, differentially expressed genes; IS, ischemic stroke; TFs, transcription factors