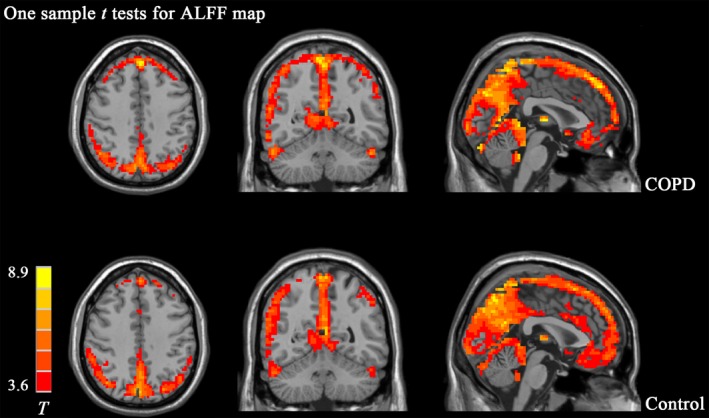
Figure 1.

One‐sample t test s of ALFF map in COPD group and control group. T maps showing areas (Red color) in which ALFF value is significantly greater than whole brain mean are listed on the upper panel for COPD group, and bottom panel for Control group. Those areas mainly include the posterior cingulate cortex (PCC), precuneus (PCu), and medial prefrontal cortex (mPFC) which resembles the pattern of default‐mode network. No apparent difference was observed in the basic patterns of ALFF between the two groups
