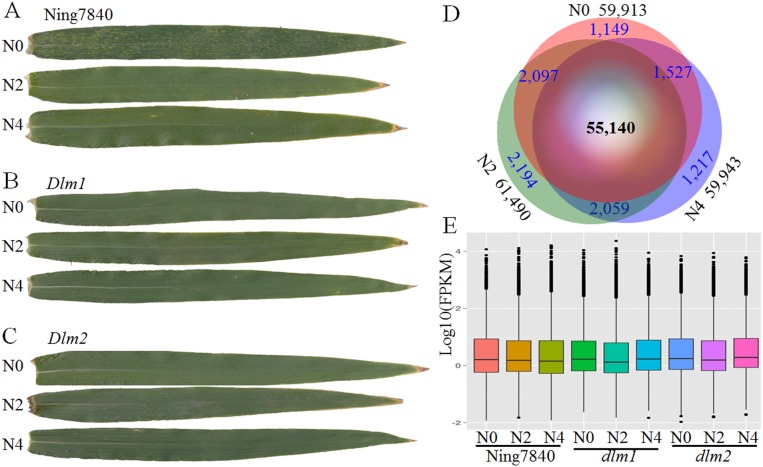
Figure 1. RNA-seq data and expressed transcripts under the different nitrogen treatments.
N0, N2 and N4 represent the treatment with 0 g, 2 g or 4 g of carbamide per pot, respectively. (A) In Ning7840, small yellowish spots appear randomly on the leaves at heading stage under N0, whereas the spots are not observed under N2 and N4 treatments, and the yellowish spots did not appear on the leaves of Dlm1 (B) and Dlm2 (C) mutants, irrespective of N fertilizer dosage. (D) Venn diagram of transcripts unique and common across the three levels of nitrogen treatments and the number of expressed transcripts. (E) Distribution of FPKM in the nine libraries for the three genotypes under three N levels.

