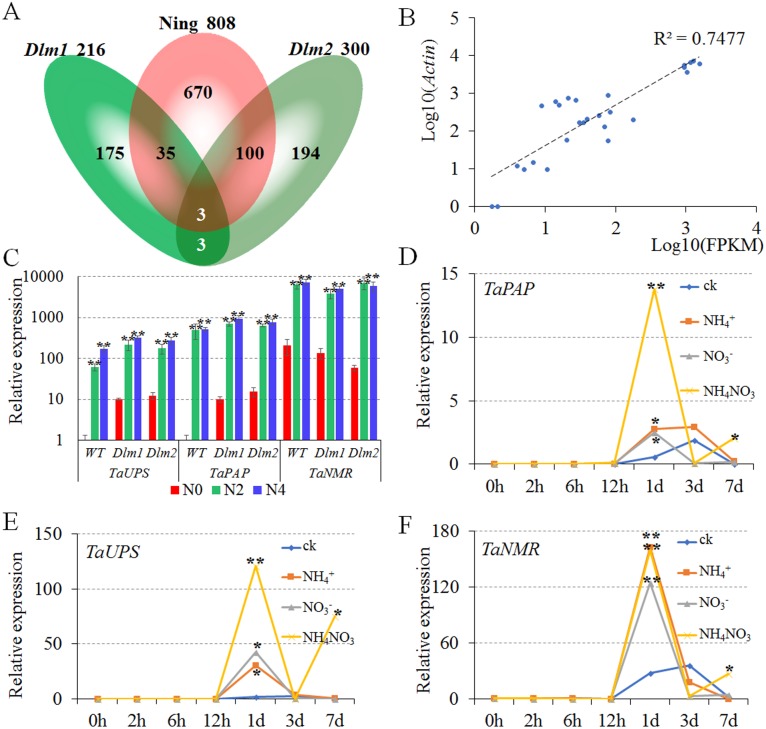
Figure 2. Verification and the expression patterns of conserved nitrogen metabolism-related genes.
N0, N2 and N4 represent the treatment with 0 g, 2 g or 4 g of carbamide per pot, respectively. (A) Venn diagram of nitrogen-related DEGs unique and common with the number of differentially expressed genes. (B) The relative expression level of DEGs (Log10(Actin)) was highly correlated with the FPKM of transcriptome analysis (Log10(FPKM)). (C) The TaPAP, TaUPS and TaNMR were significantly up-regulated under N2 and N4 treatments compared to N0 in Ning7840, Dlm1 and Dlm2 mutants. (D–F) Expression pattern of TaPAP (D), TaUPS (E) and TaNMR (F), respectively. The expression of TaPAP, TaUPS and TaNMR were significantly up-regulated at 1 d under all the nitrogen treatments and were significantly up-regulated at 7 d only under the treatment with NH4NO3 when compared to CK.

