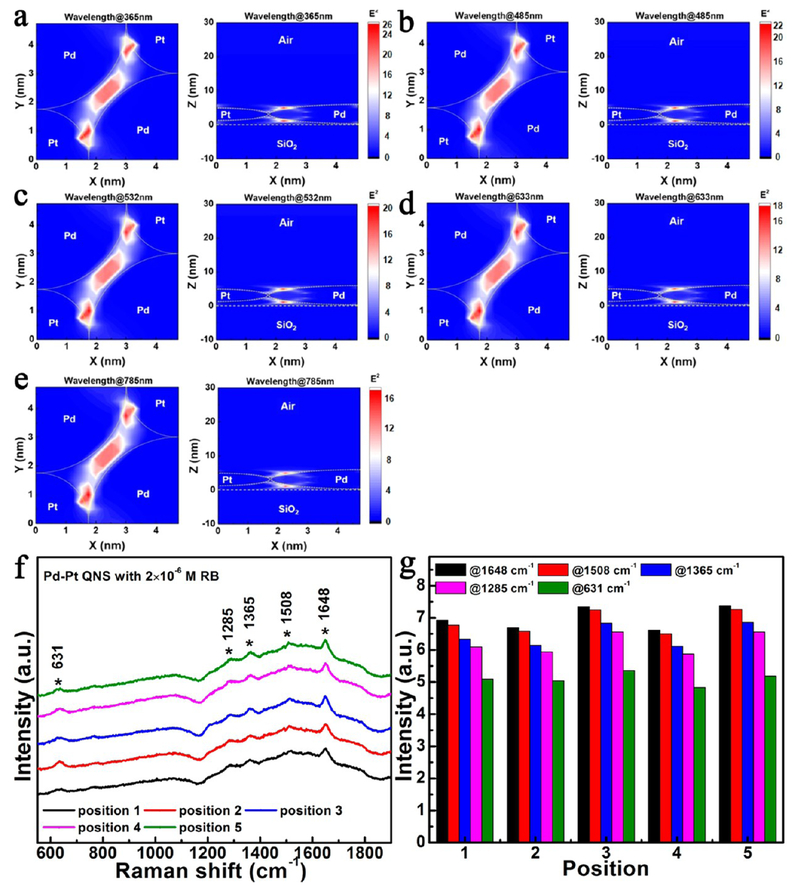
Figure 8.
Near-field electric field distributions of incident light at the wavelengths of (a) 365 nm, (b) 485 nm, (c) 532 nm, (d) 633 nm, and (e) 785 nm, passing through the Pd–Pt QNS on a glass substrate. Measured (f) Raman spectra and (g) Raman peak signals of Pd–Pt QNS with 2 × 10⁻⁶ M Rhodamine B (RB), recorded at five different positions within an area of 0.5 × 0.5 mm2 with a spacing of 100 μm.

