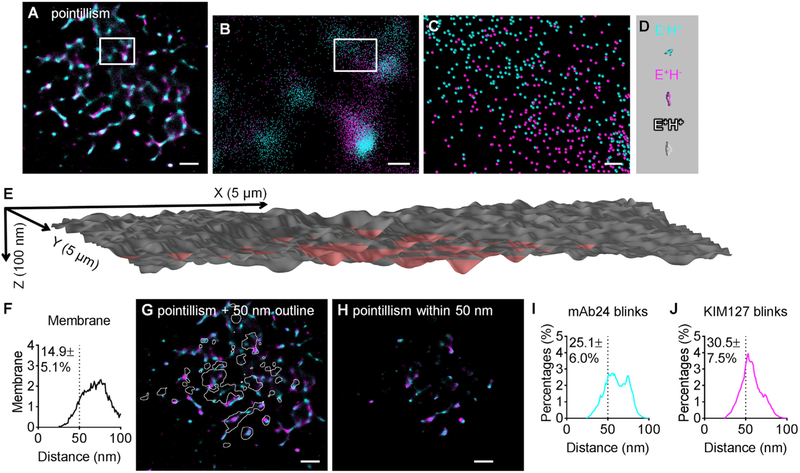
Figure 2. Pointillism Map of H+ and E+ Locations within 50 nm of the Substrate Generated from STORM Imaging.
(A–C) Pointillism map of locations of H+ and E+ generated from STORM imaging (details in STAR Methods), with zoomed-in images in (B) (box in A) and (C) (box in B).
(D) Structures of three active conformations of β2-integrins (E−H+, cyan; E+H−, magenta; and E+H+, gray) at the same scale as (C).
(E) 3D topography of a neutrophil footprint generated from the TIRF image of anti-CD16-Alexa Fluor 488 (AF488), as in Fan et al. (2016) and Sundd et al. (2010, 2012). CD16 is a homogeneously distributed GPI-anchored protein. The area within 50 nm of the substrate is highlighted in red. The x, y, and z scales indicated.
(F) Distribution of distances between the neutrophil membrane and the coverslip substrate.
(G) STORM pointillism map (A) overlaid with white outlines showing the area within 50 nm of the substrate.
(H) Pointillism map gated for areas within 50 nm of the substrate.
(I and J) Distribution of distances between mAb24 blinks (I) and KIM127 blinks (J) within 50 nm of the substrate.
Scale bars are 1 μm for (A), (G), and (H); 200 nm for (B); and 30 nm for (C). Averaged distribution curves and the percentages within 50 nm (mean ± SD) of six cells shown in (F), (I), and (J). Histograms of each cell are shown in Figure S7. See also Figures S6–S8 and Tables S1 and S3.

