
FIGURE 1.
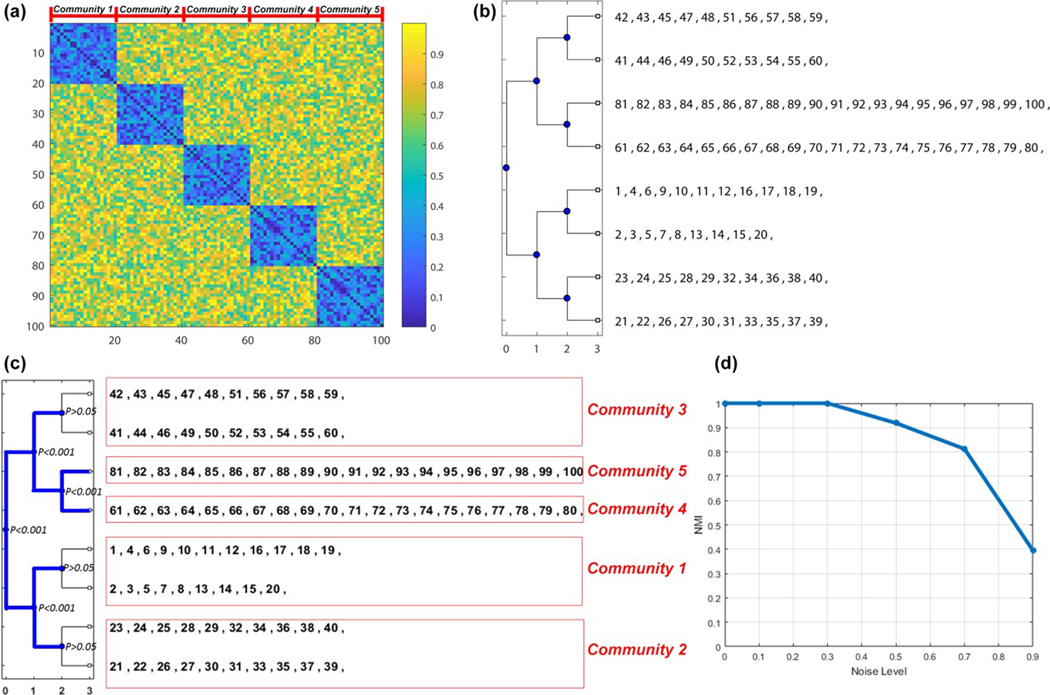
Simulation study for PACE. (a) A 100 × 100 5-community edge-negative probability map was generated, where each module has 20 nodes. Within-community, the edge negativity value is uniformly randomly selected from 0 to 0.5 and between-community, the value from 0.5 to 1; (b) three-level PACE was computed and eight communities were generated; (c) using 1,000 permutations randomly exchanging edge positivity with negativity, we constructed the null distribution of Ψ, using which we tested the significance of each bifurcation. For the four possible bifurcations at the third-level PACE, only one was significant (significant bifurcations highlighted in blue), thus yielding a total of five modules, each of which matches the corresponding module in the ground truth (highlighted by the red square; from top to bottom, module correspondence is 3, 5, 4, 1, 2); (d) the performance of PACE in this toy example under different noise levels (L = 0.1, 0.3, 0.5, 0.7, and 0.9; the exact procedure of how L is applied is discussed in the Supporting Information) [Color figure can be viewed at wileyonlinelibrary.com]