Figure 3.

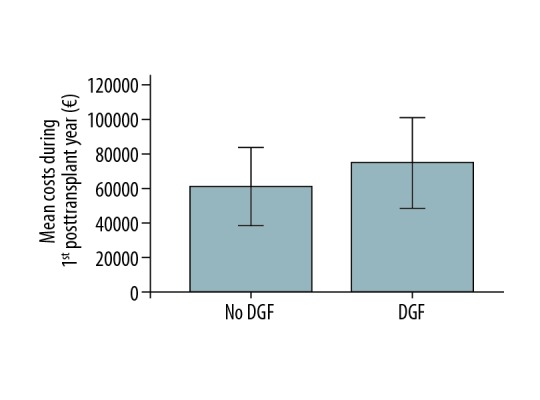
Comparison of total costs (in euros) during the first posttransplant year between patients with delayed graft function (DGF) and early graft function after kidney transplantation. Error bars represent 1 standard deviation.

Comparison of total costs (in euros) during the first posttransplant year between patients with delayed graft function (DGF) and early graft function after kidney transplantation. Error bars represent 1 standard deviation.