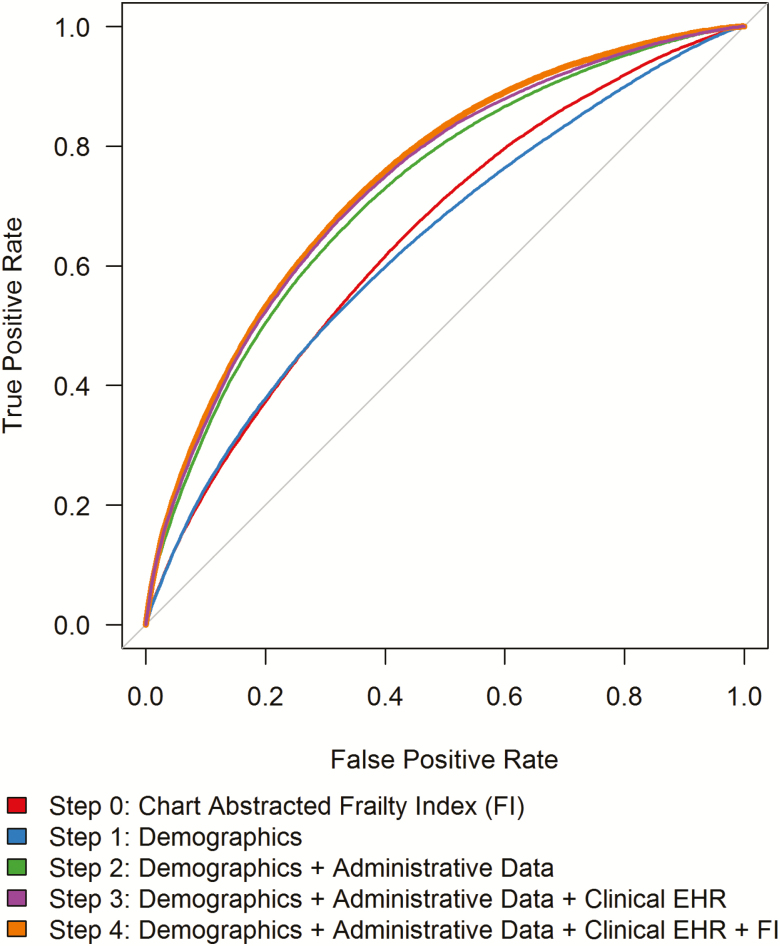
Figure 2.
Receiver operating characteristic curves for stepwise Cox proportional hazards models using administrative variables and patient frailty (FI) to predict time-to-death at median survival time of 3.4 years. Step 0 predicts time-to-death by chart-abstracted frailty unadjusted for any covariates. Additional steps build sequentially including: demographics (Step 1); administrative data (Step 2); clinical electronic health record (EHR) data (Step 3); chart-abstracted frailty index (Step 4). C-statistics for each step: Step 0 = 0.67 (frailty alone); Step 1 = 0.64; Step 2 = 0.70; Step 3 = 0.70; Step 4 = 0.72.

