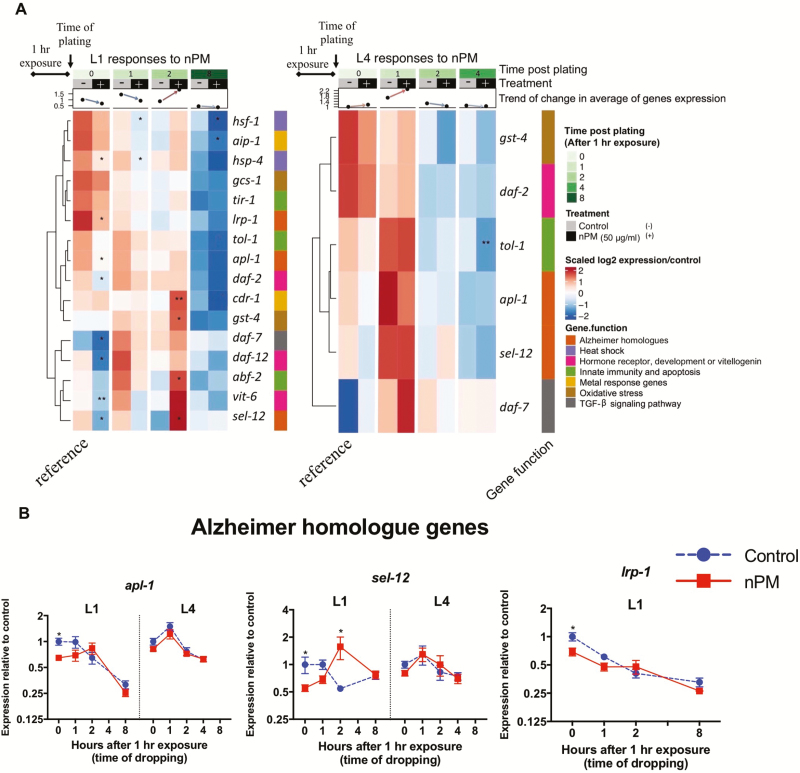
Figure 3.
mRNA response to nPM varies with developmental stage. (A) Heatmap showing the mRNA changes of the selected genes in L1 and L4 stage animals exposed to 50 μg/mL nPM for 1 hour (n = 4–5 replicates, ~500 animals/replicate). RNA levels were followed for 8 hours post-exposure in L1 stage animals and 4 hours post-exposure in L4 stage animals. Responses are clustered based on Euclidian distance using complete linkage method. The heatmap is annotated with the time point, treatment, life stage, average of mRNA changes and the function of target genes. Significant changes are shown in the heatmap. (B) mRNA changes of Alzheimer homolog genes in C. elegans to nPM. The t-test was used to compare nPM and controls at each time. p-values: <.05 (*), <0.01(**), <0.001(***), <0.0001(****).

