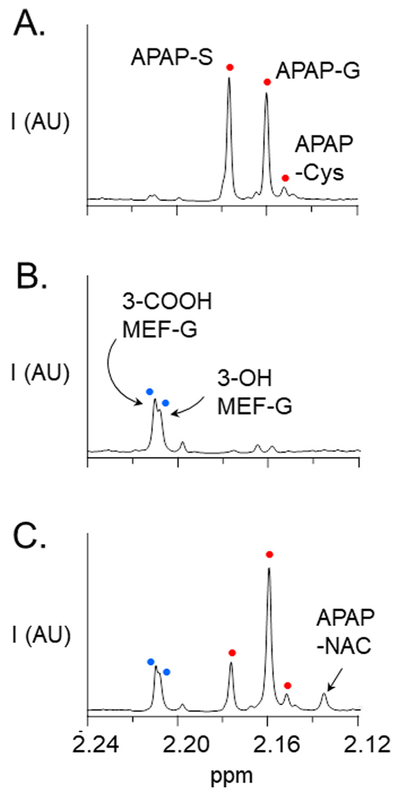
Fig. 2.
1H NMR spectrum of APAP and Mef metabolites in urine. Panel A. APAP (oral 1.0 g dose). Panel B. Mef (oral 750 mg dose). Panel C. APAP (1.0 g) + Mef (750 mg) taken simultaneously. Samples were collected at the end of the one-to-two hour interval following oral administration of drug. Spectra were acquired using a Bruker 900 MHz spectrometer equipped with a 5 mm TCI probe. Signal intensities are plotted in arbitrary units (AU). NMR pulse parameters are described in Methods (see, NMR Measurements). Spectral assignments are based on published literature (20, 21, 35, 36). Metabolite acronyms are as follows: APAP-S (acetaminophen sulfonate); APAP-G (acetaminophen glucuronide); APAP-Cys (acetaminophen cysteine); APAP-NAC (acetaminophen N-acetylcysteine); 3-COOH Mef-G (3-carboxy mefenamic glucuronide); 3-OH Mef-G (3-hydroxymethyl mefenamic glucuronide). White and black dots in Panels A and B correspond to those in Panel C.

