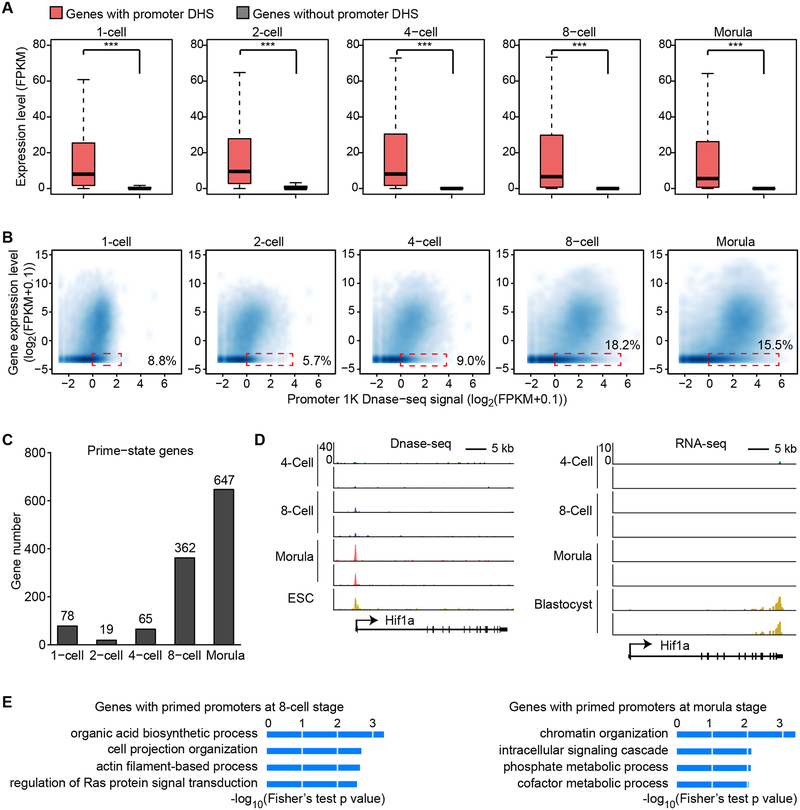
Figure 3. DNase accessibility marks promoters that are active or primed for activation in later stages.
(A) Box plot showing the expression level of genes with or without promoter DHSs. Boxes and whiskers represent the 25th/75th and 2.5th/97.5th percentiles, respectively. The difference between the two groups are statistically significant by Wilcoxon rank sum test (*** denotes p < 0.001).
(B) Scatter plot showing the correlation between gene expression level and promoter DNase I hypersensitivity signal. Dashed red rectangles represent non-expressed genes (RNA-seq FPKM < 0.1) harboring promoter DHS signals (DNase-seq RPM > 1).
(C) Bar graph showing number of genes with promoter DHSs that are transcriptionally inactive at the indicated stage but are activated in the following stage (primed-state).
(D) Genome browser view of Hif1a locus as a representative example of primed-state genes. DNase-seq signal is shown on the left. RNA-seq data is shown on the right.
(E) Gene ontology analysis of primed-state genes at the 8-cell and morula stages using DAVID. The enriched terms are ranked by–log10(p-value).
See also Figure S4.

