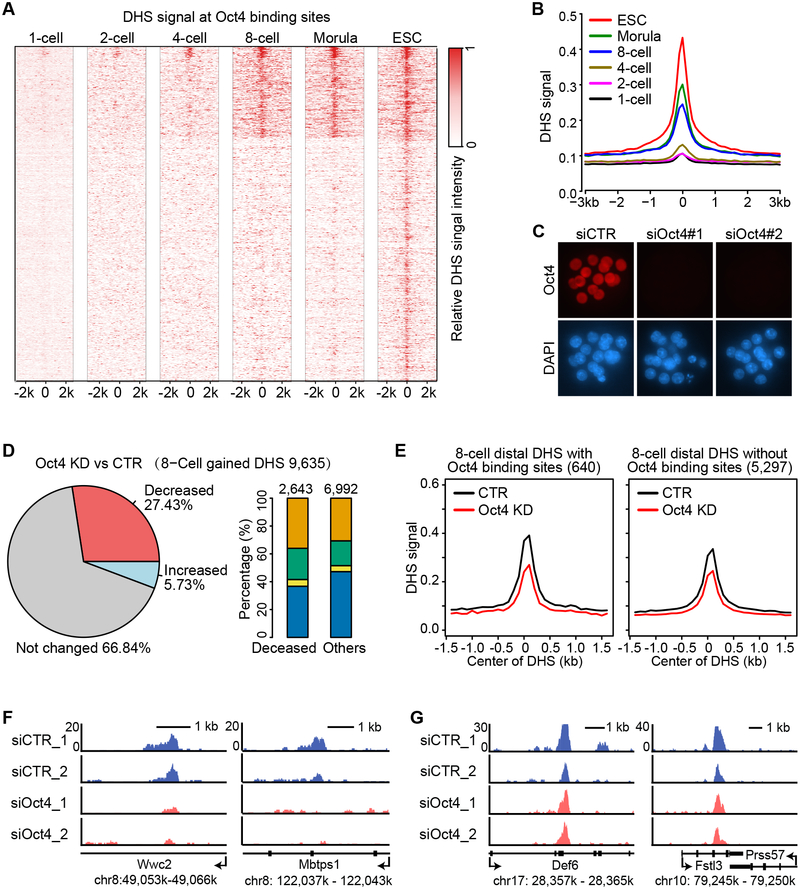
Figure 6. Oct4 contributes to distal DHS establishment at the 8-cell stage.
(A) Heat map showing that presumable Oct4 binding sites become accessible starting from the 8-cell stage. Each row is centered at the mid-point of an Oct4 binding site identified in ESCs.
(B) Average DHS signals at the presumable Oct4 binding sites showing a marked increase at the 8-cell stage.
(C) Representative images of morula embryos stained with anti-Oct4 (red) and DAPI (blue) showing that Oct4 protein is efficiently depleted by siRNA injection. More than 5 embryos per group were examined.
(D) A large proportion of 8-cell gained DHSs are decreased (FC > 2) upon Oct4 KD. Pie-chart (left) shows the proportion of DHSs decreased, increased, or unchanged upon Oct4 KD. Bar graph (right) shows the genomic distribution of either decreased or the rest of DHSs. Orange, green, yellow, and blue represent intergenic, intron, exon, and promoter regions, respectively.
(E) Average DHS signals at 8-cell distal DHSs with or without presumed Oct4 binding sites in control (CTR) and Oct4 KD 8-cell embryos.
(F) Representative loci containing presumed Oct4 binding sites with reduced distal DHS upon Oct4 KD.
(G) Representative loci without presumed Oct4 binding sites with distal DHS unaffected by Oct4 KD.
See also Figure S6.

