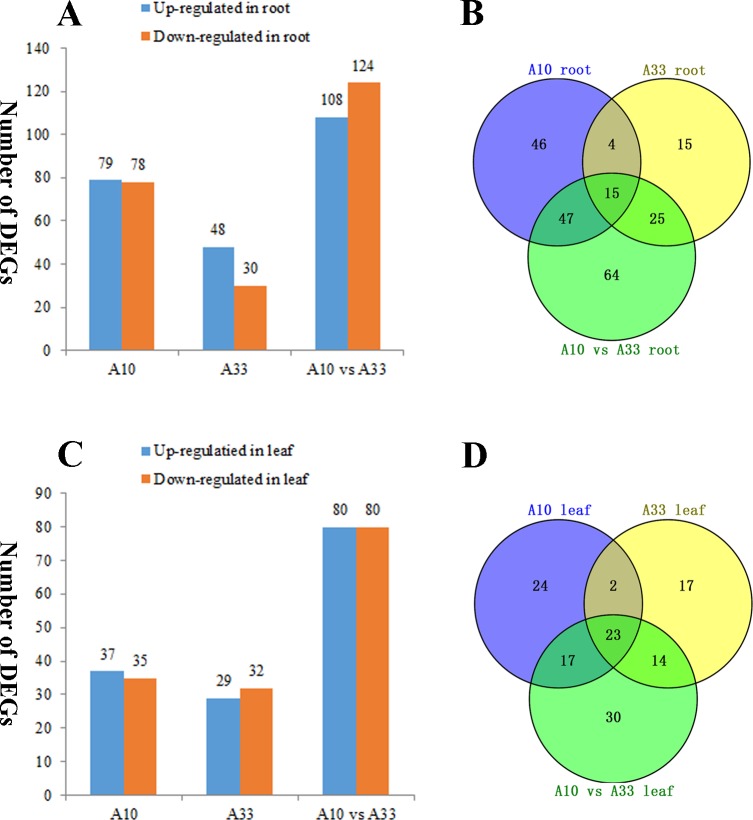
Fig 2. Overview of the 127 leaf-based DEGs and 216 root-based DEGs at the six time points (0 h, 6 h, 12 h, 24 h, 48 h and 78 h).
(A) Numbers of DEGs compared between two samples in root at the six time points (0 h, 6 h, 12 h, 24 h, 48 h and 78 h). (B) Venn diagram showing the overlap of the DEGs at the six time points between “A10” root, “A33” root and “A10” vs “A33” root. (C) Numbers of the DEGs compared between two samples in leaf at the six time points (0 h, 6 h, 12 h, 24 h, 48 h and 78 h). (D) Venn diagram showing the overlap of the DEGs at the six time points between “A10” leaf, “A33” leaf and “A10” vs “A33” leaf. A10: sum of the DEGs in “A10-0h vs A10-6h”, “A10-0h vs A10-12h”, “A10-0h vs A10-24h”, “A10-0h vs A10-48h”, “A10-0h vs A10-78h”. A33: sum of the DEGs in “A33-0h vs A33-6h”, “A33-0h vs A33-12h”, “A33-0h vs A33-24h”, “A33-0h vs A33-48h”, “A33-0h vs A33-78h”. “A10 vs A33”: sum of the DEGs in “A10-0h vs A33-0h”, “A10-6h vs A33-6h”, “A10-12h vs A33-12h”, “A10-24h vs A33-24h”, “A10-48h vs A33-48h”, “A10-78h vs A33-78h”.

