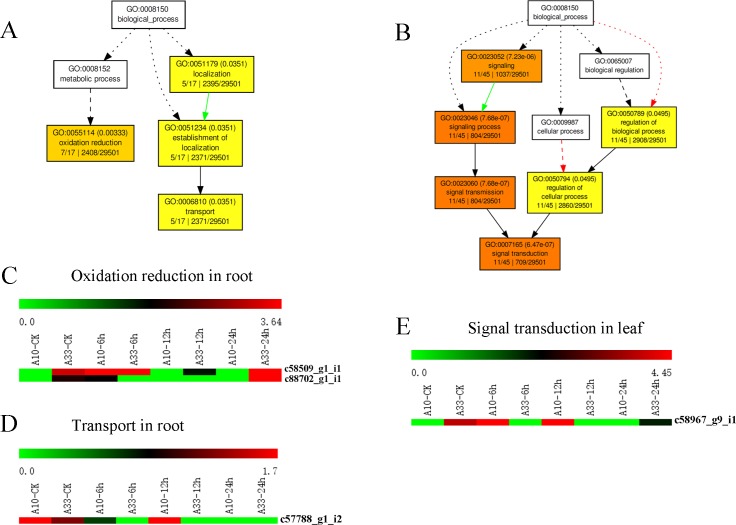
Fig 4. The GO enrichment of the four DEGs between “A10” and “A33” at CK (0h) and at the salt stress treatment stages (6 h, 12 h, and 24 h).
(A) The GO enrichment of the DEGs between the “A10” root and the “A33” root at CK (0 h) and at the salt stress treatment stages (6 h, 12 h, and 24 h). (B) The GO enrichment of the DEGs between the “A10” leaf and the “A33” leaf at CK (0 h) and at the salt stress treatment stages (6 h, 12 h, and 24 h). (C) and (D) The heatmaps of the DEGs of enriched GO terms between the “A10” root and the “A33” root at CK (0 h) and at the salt stress treatment stages (6 h, 12 h, and 24 h). (E) The heatmaps of DEGs of enriched GO terms between the “A10” leaf and the “A33” leaf at CK (0 h) and at the salt stress treatment stages (6 h, 12 h, and 24 h).

