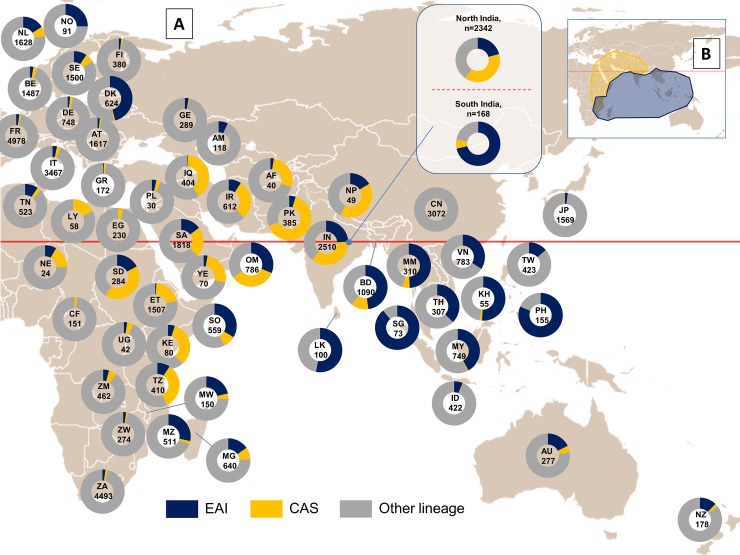
Fig 2. Distribution map of EAI and CAS vs. other MTBC lineages in Eastern hemisphere.
(A) Map representing distribution of respective lineages taking in account proportions >2% for each lineage group (data based on country of isolation; when not available, the country of origin of patients such as for Afghanistan, Somalia, and Niger, was taken in account). Map freely available under Creative Commons License (http://en.wikipedia.org/wiki/Tropic_of_Cancer). Reprinted from https://en.wikipedia.org/wiki/Tropic_of_Cancer#/media/File:World_map_with_tropic_of_cancer.svg under a CC BY license, with permission from Mr. Laurent Cozic, original copyright 2009. (B) A smaller map in inset represents potential main dispersal areas of CAS (yellow) and EAI (blue) lineages.

