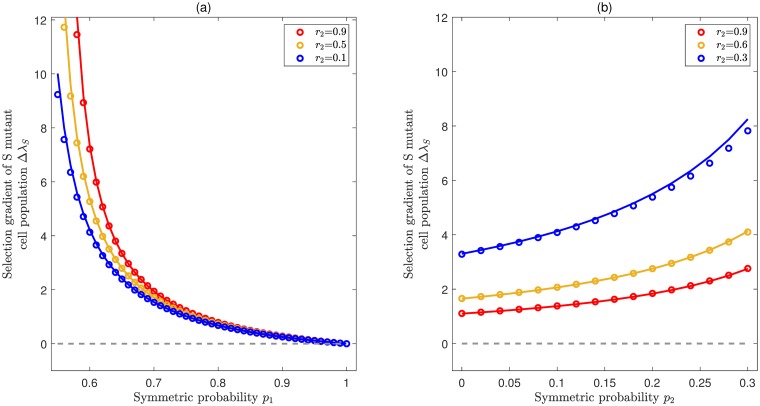
Fig 2. Selection for stepwise de-differentiation when the effective rate of self renewal is highest for stem cells.
Illustration of the selection gradient (comparative fitness) of the S mutant cell population ΔλS as a function of division rates and symmetric division probabilities, provided that the stem cell compartment has the largest effective self-renewal rate, i.e. λ0 = r1(p1 − q1). In both panels, colored lines represent analytical approximations from Eq (8) by using the eigenvalue perturbation method and symbols represent exact numerical solutions, which agree very well with each other. The common parameters are n = 4, κ = 0.1, ρ = 0.001, d = 0.05, r1 = 0.99, r3 = 0.3. (a) Expanding case (λ0 > 0). De-differentiation provides a fitness advantage for all values of p1 and r2. Here p2 = 0.55, p3 = 0.6 and the range of p1 (0.55 < p1 < 1.0) ensures that r1(p1 − q1) is the largest eigenvalue. (b) Homeostasis case (λ0 = 0). De-differentiation also provides a fitness advantage for all values of p2 and r2. Here p1 = 0.5, p3 = 0 and the range of p2 (0 < p1 < 0.3) ensures that λ0 = 0 is the largest eigenvalue.

