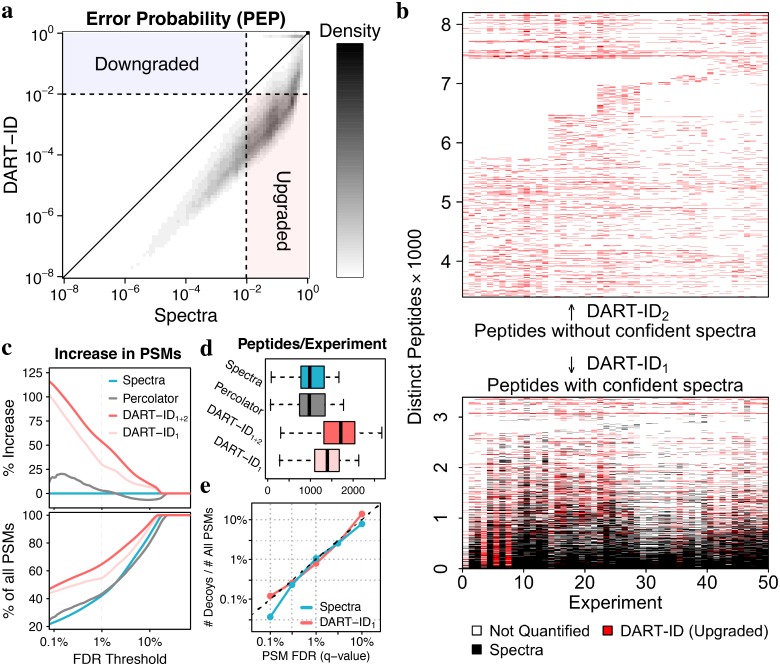
Fig 3. Incorporating RTs increases confident peptide identifications.
(a) A 2D density distribution of error probabilities derived from spectra alone (Spectral PEP), compared to that after incorporating RT evidence (DART-ID PEP). (b) Map of all peptides observed across all experiments. Black marks indicate peptides with Spectral FDR < 1%, and red marks peptides with DART-ID FDR < 1%. (c) Increase in confident PSMs (top), and in the fraction of all PSMs (bottom) across the confidence range of the x-axis. The curves correspond to PEPs estimated from spectra alone, from spectra and RTs using percolator and from spectra and RTs using DART-ID. DART-ID identifications are split into DART-ID1 and DART-ID2 depending on whether the peptides have confident spectral PSMs as marked in panel (b). (d) Distributions of number of unique peptides identified per experiment. (e) The fraction of decoys, i.e. the number of decoy hits divided by the total number of PSMs, as a function of the FDR estimated from spectra alone or from DART-ID. The Spectral FDR is estimated from separate MaxQuant searches, with the FDR applied on the peptide level.

