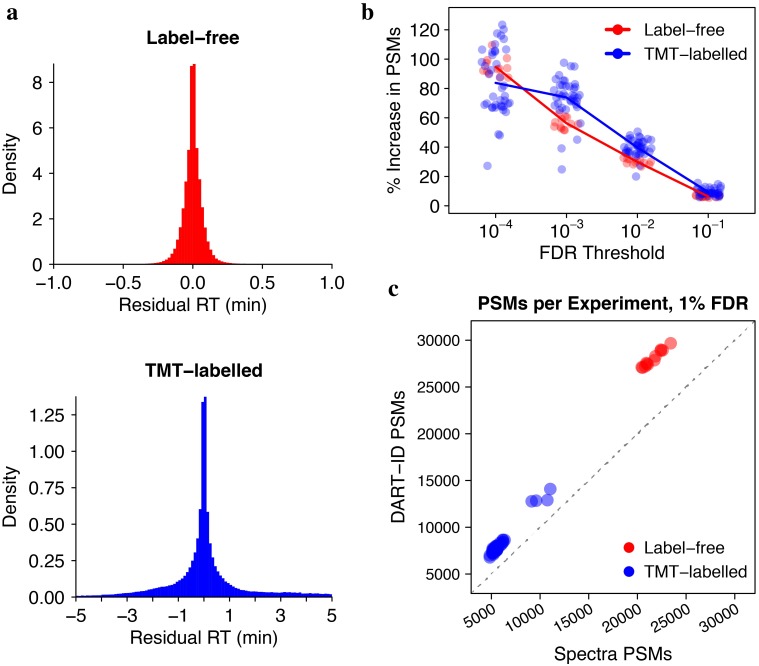
Fig 4. Application of DART-ID on bulk LC-MS/MS runs.
Residual RTs after DART-ID alignment for (a) label-free dataset [57] and TMT-labelled dataset [58]. (b) DART-ID doubles the PSMs at 0.01% FDR and increase them by about 40% at 1% FDR. Each circle corresponds to the number of PSMs in an LC-MS/MS run. (c) Number of PSMs per run at 1% FDR, after applying DART-ID versus before its application. The x-coordinate represents the Spectra PSMs and and y-coordinate represents the DART-ID PSMs at 1% FDR.

