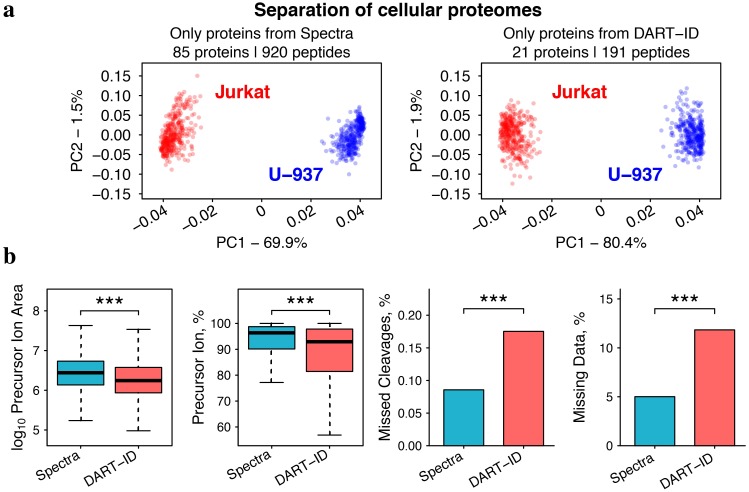
Fig 8. Quantification of proteins identified by spectra alone and by DART-ID.
(a) Principal component analysis of the proteomes of 375 samples corresponding to either T-cells (Jurkat cell line) or to monocytes (U-937 cell line). The Spectra set contains proteins with Spectral PSMs filtered at 1% FDR, and the DART-ID set contains a disjoint set of proteins quantified from PSMs with high Spectral PEP but low DART-ID PEP. Only peptides with less than 5% missing data were used for this analysis, and the missing data were imputed. (b) The distributions of some features of the Spectra and DART-ID PSMs differ slightly. These features include: precursor ion area is the area under the MS1 elution peak and reflects peptide abundance; precursor ion fraction which reflects MS2 spectral purity; missed cleavages is the average number of internal lysine and arginine residues; and % missing data is the average fraction of missing TMT reporter ion quantitation per PSM. All distributions are significantly different, with p < 10−4.

