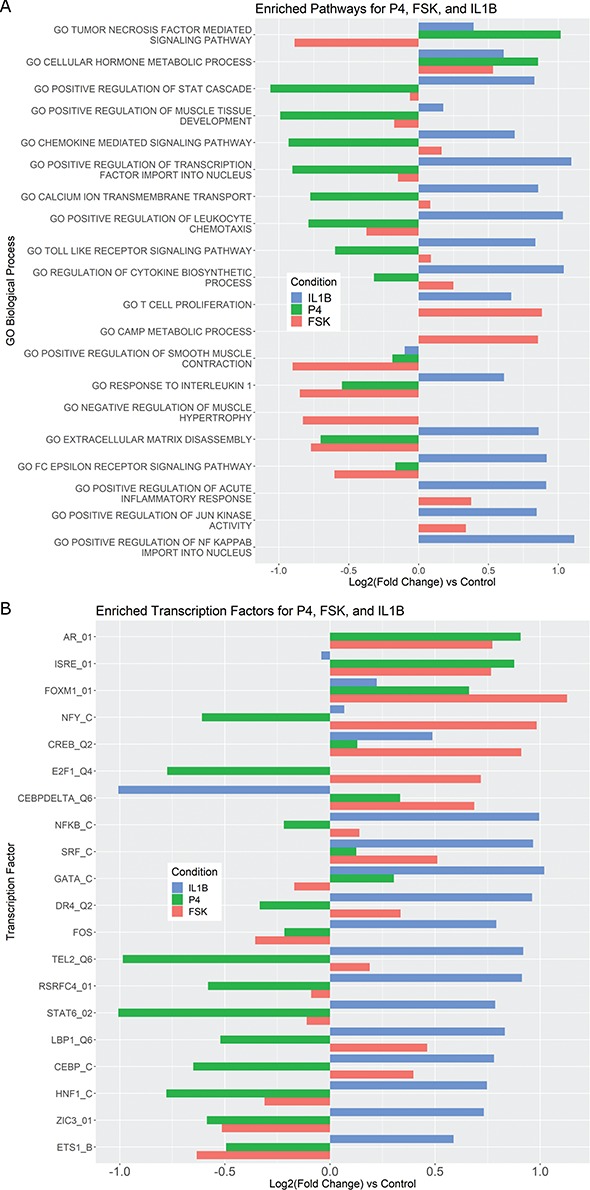
Figure 3.

Pathways and TFs that exhibit significant enrichment in differential expression in response to treatment by P4, FSK, and IL-1 individually. The gene set collections for GO BPs and TF-targets were obtained from the MSigDB. Gene sets significant (|fold change| > 1.5 and adjusted P-value < 0.05) in any single stimulus condition versus control were identified using GSVA. For a subset of these significant A. pathways and B. TFs, the magnitude and direction of the collective fold change of the genes in the corresponding gene set, as quantified by GSVA, is shown using three bars colored according to the stimulus. See Supplementary Tables V and VI for enrichment fold change values for all GOBP and TF terms, respectively, significant in at least one single stimulus condition compared to control.
