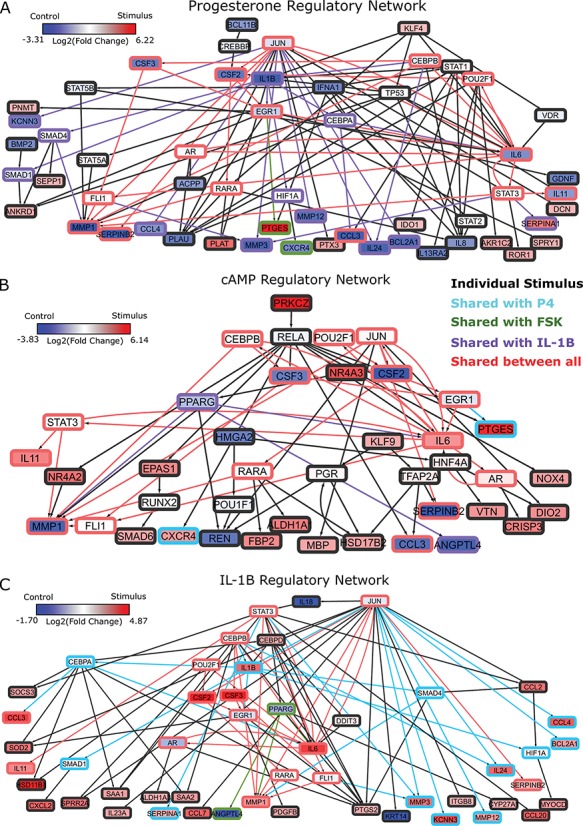
Figure 4.

Regulatory networks representing the effects of each individual stimulus. RNEA was performed and significant subnetworks were identified in samples treated by A. P4, B. FSK (cAMP), and C. IL-1 based on gene expression alterations compared to control. Nodes (genes and TFs) are colored based on
  . Edges (regulatory interactions) and node outlines are colored based on occurrence in the three shown networks.
  cutoffs used for significance in the RNEA function were 1.5 for P4 and IL-1
 and 1.75 for FSK. Visualization was performed using Cytoscape. See Supplementary Files I–III for full RNEA networks for P4, FSK, and IL-1
 , respectively.
