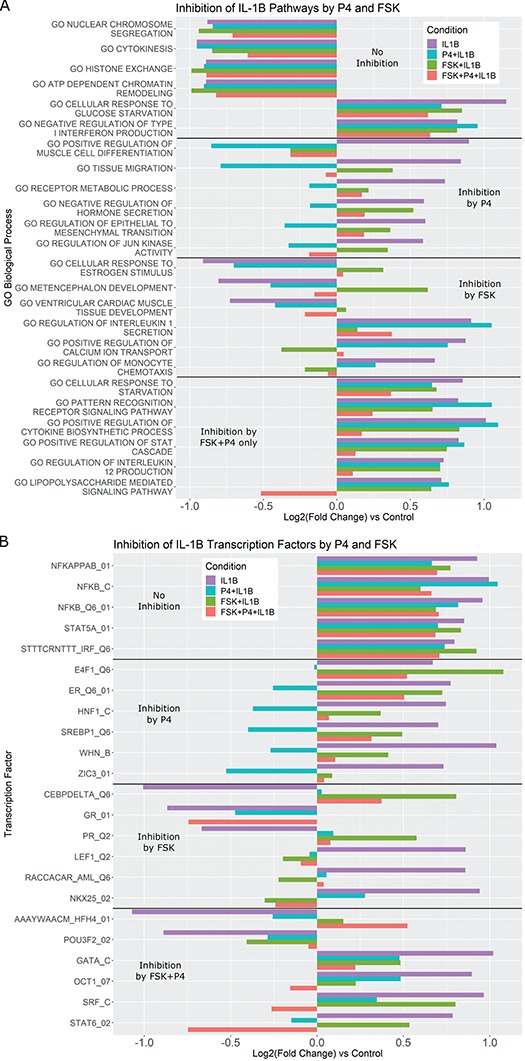
Figure 6.

Pathways that are activated/inhibited by IL-1 are inhibited/activated by different combinations of P4 and FSK. The gene set collections of GO BPs and Transcription Factor-Targets were obtained from the MSigDB. Gene sets significantly altered (|fold change| > 1.5 and adjusted P-value < 0.05) from control to IL-1
 were identified using GSVA. These gene sets were then re-evaluated by GSVA for the conditions of P4 + IL-1
 , FSK + IL-1
 , and FSK + P4 + IL-1
 compared with control. These gene sets were classified into four categories according to their regulation pattern: (i) no inhibition (activated by IL-1
 and not inhibited by the addition of P4 and/or FSK), (ii) inhibition by P4 (activated by IL-1
 , but this activation was reversed by the addition of P4), (iii) inhibition by FSK (activated/inhibited by IL-1
 , but this activation/inhibition was reversed by the addition of FSK), (iv) inhibition by P4 + FSK (activated/inhibited by IL-1
 , this regulation was not reversed by the addition of P4 or FSK individually, but it was reversed by the addition of P4 and FSK together). For each of these four categories, the fold change of sample gene sets (representing A. GO BPs, B. Transcription Factor-Targets) in response to different combinations of stimuli are shown. See Supplementary Tables VII and VIII
for enrichment fold change values for all GO BP and TF terms, respectively, significant in IL-1
 compared to control. These include enrichment fold changes for all IL-1
 conditions.
