
Figure 7.
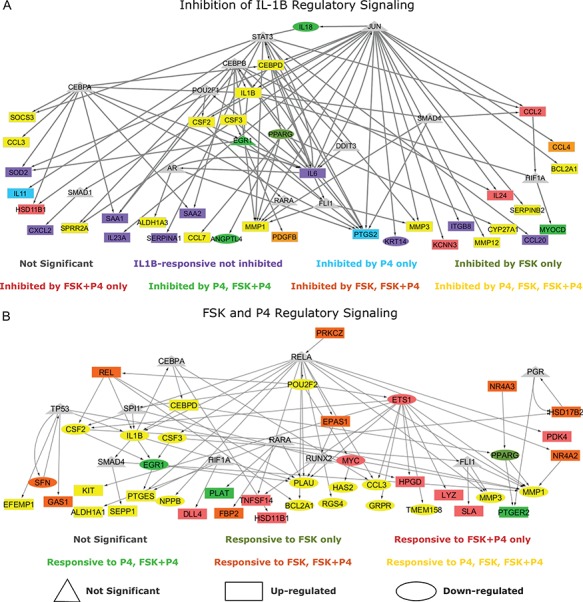
Regulation interplay of genomic signaling by IL-1
 , FSK, and P4.
A. Inhibition of the regulatory network induced by IL-1
, FSK, and P4.
A. Inhibition of the regulatory network induced by IL-1 (same network and inputs used for Fig. 5C) by different combinations of P4 and FSK (e.g. an orange node is significant in IL-1
 versus Ctrl and remains significant in the same direction in P4 + IL-1
 versus Ctrl but becomes insignificant or significant in the opposite direction in FSK + IL-1
 versus Ctrl and FSK + P4 + IL-1
 versus Ctrl). B. Regulatory patterns of P4 and FSK. The network is obtained by performing RNEA for FSK + P4 versus Ctrl with a
  cutoff of 2.4 and P-value cutoff of 0.05. Node colors are based on P4 versus Ctrl, FSK versus Ctrl, and FSK + P4 versus Ctrl expression comparisons. Node shape indicates differential expression of each node, including direction of regulation. See Supplementary File IV
for full RNEA networks for FSK + P4.
cutoff of 2.4 and P-value cutoff of 0.05. Node colors are based on P4 versus Ctrl, FSK versus Ctrl, and FSK + P4 versus Ctrl expression comparisons. Node shape indicates differential expression of each node, including direction of regulation. See Supplementary File IV
for full RNEA networks for FSK + P4.