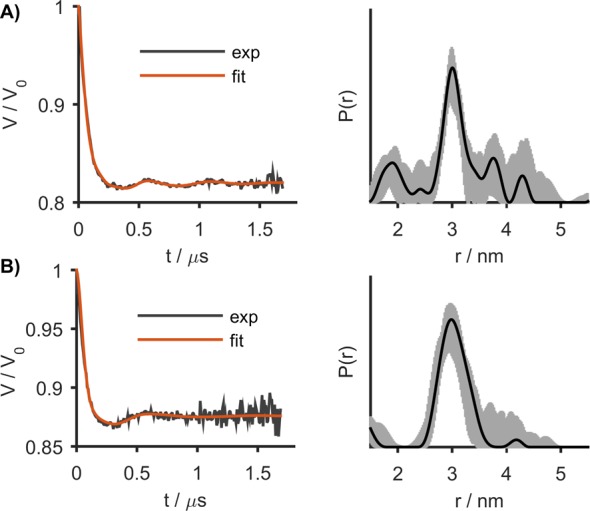
Figure 3.

RIDME form factors (left) and the corresponding distance distributions (right) for Gd-ruler-3.0 in cell extract (A) and in oocytes (B). Gray areas in the right panels show the uncertainty range (as defined in the Supporting Information) in the distance distributions.
