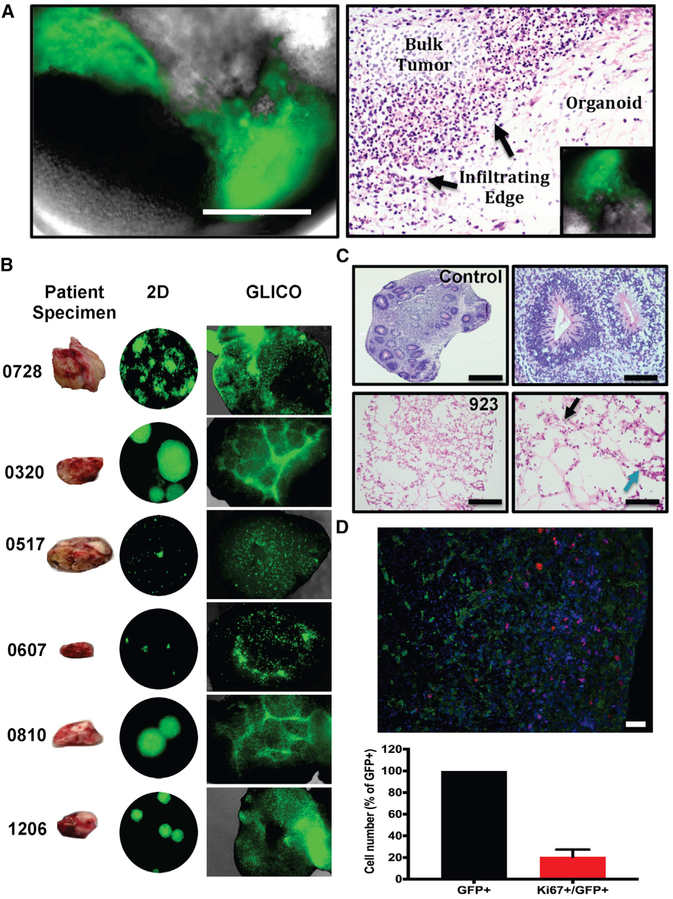
Figure 1. Patient-Derived GSCs Form Infiltrative Tumors in Cerebral Organoids.
(A) Tumor formation from GFP-expressing 827 GSCs (left) 1 week after co-culture; scale bar, 400 μm; n = 6 organoids per cell line.
(B) Historical development of patient-derived GLICOs from six patient tumor specimens.
(C) Diffuse GSC infiltration (blue arrow indicates tumor cells) of the organoid as evident by morphological (H&E) analysis of control organoids (top) and GFP-expressing 923 GLICO tumors (bottom) at day 14; scale bars, 1,000 μm (left) and 100 μm (right); six organoids were analyzed per group. Tumors exhibit necrosis (black arrow).
(D) Representative image and bar graph showing quantification of Ki67+/GFP+ cells in GFP+ 923 GLICO tumors after 2 weeks of growth; green, GFP; red, Ki67; blue, DAPI; n = 3 organoids; scale bar, 50 μm.

