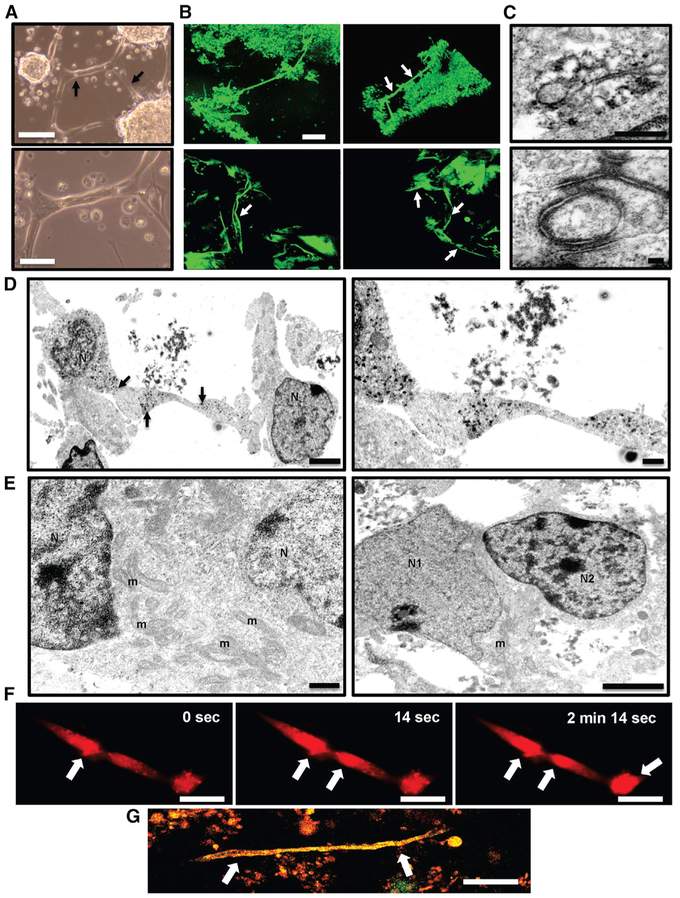
Figure 2. GLICO Tumor Growth Is Supported by a Network of Tumor Microtubes.
(A) Formation of 923 GSC-derived tumor micro-tubes in vitro after 12 days in 2D culture (arrows); scale bar, 200 μm (top) and 100 μm (bottom).
(B) Two-photon microscopy of tumor microtubes (arrows) in GLICO tumor from GFP-positive 923 GSCs; day 10; 3D rendering of GLICO tumor, top; individual z stack images of microtubes, bottom; scale bar, 80 μm; n = 3 organoids.
(C) Electron micrographs of peroxidase-based immunolabeling of connexin-43-positive gap junctions (top) and desmosomes (bottom) in GFP-positive 923 GLICO tumors; scale bars, 500 nm (top) and 100 nm (bottom); n = 5 organoids.
(D) Electron micrographs showing tube-like connections between 923 GLICO tumor cells; arrows indicate peroxidase labeling for connexin-43; scale bars, 2 μm (left) and 500 nm (right).
(E) Cytoplasmic fusion between two 0728 GLICO tumor cells (left) and a cytoplasmic fusion between a neuron and 0728 GLICO tumor cell (right); scale bars, 500 nm (left) and 2 mm (right); m, mitochondria; N, nucleus; N1, neuronal nucleus; N2, 0728 tumor cell nucleus; n = 5 organoids.
(F) Time-lapse image of calcium waves (Rhod-2AM) traveling along 923 GSC microtubes; scale bar, 50 μm. (G) Two-photon microscopy of tumor microtube (arrows) in GLICO tumor from GFP- and RFP-positive 827 GSCs; day 10; n = 3 organoids; scale bar, 80 μm.

