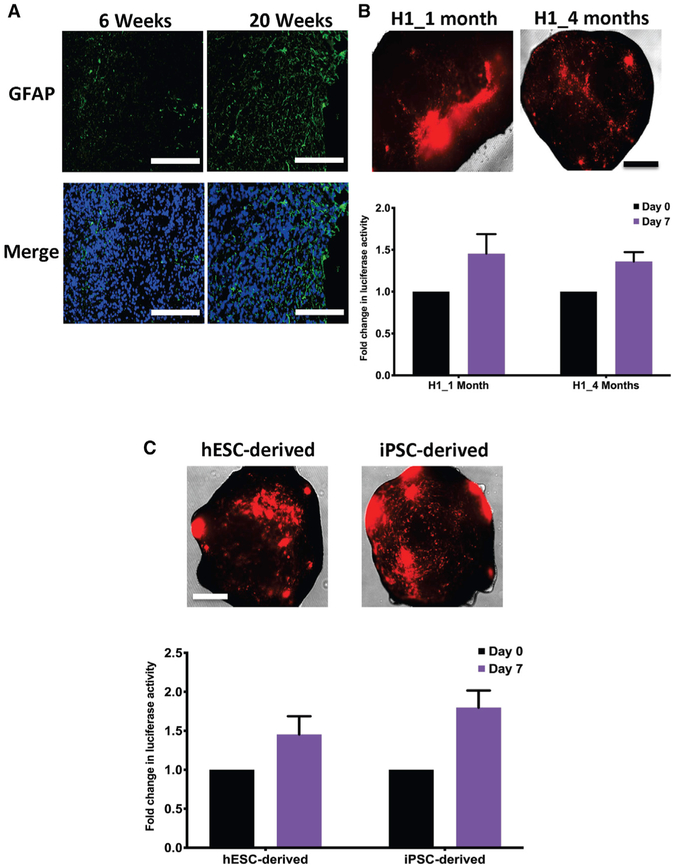
Figure 4. GLICOs Exhibit Similar Growth Rates in iPSC-Derived Organoids and in Organoids of Different Ages.
(A) Immunofluorescence staining for GFAP (green) and DAPI (blue) in 6- or 20-week-old H1-derived cerebral organoids; n = 4 organoids per time point; scale bars, 200 μm.
(B) Representative images of GLICO tumor growth (top) and quantification of secreted luciferase activity (bottom) from 923 GLICO tumors grown in either 1- or 4-month-old H1-derived cerebral organoids; n = 6 organoids per group; scale bar, 500 μm.
(C) Representative images of GLICO tumor growth (top) and quantification of secreted luciferase activity (bottom) from 923 GLICO tumors grown in either 1-month-old hESC-derived (H1) or iPSC-derived (H6) organoids; n = 6 organoids per group; scale bar, 500 μm.

