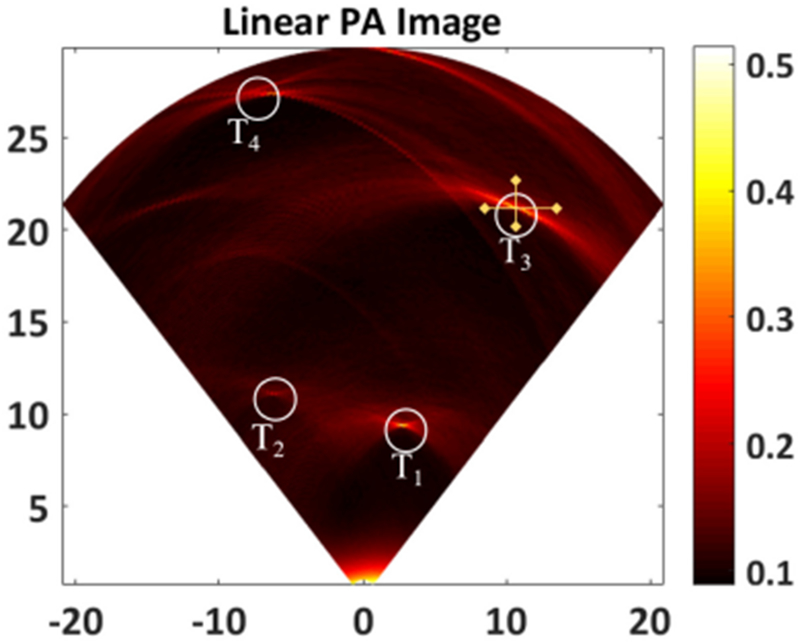
Fig. 6.

B-mode photoacoustic image reconstructed from 120 A-lines obtained from a linear scanning of the PMUT element. Circles T1, T2, T3 and T4 clearly show the photoacoustic contrast from 4 pencil lead targets embedded inside the agar phantom. The cross-hairs on T3 show the lines along which lateral and axial resolutions were calculated.
