
Figure 5.
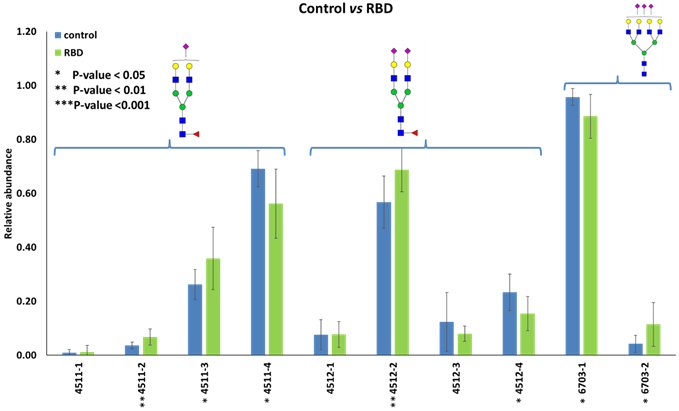
Bar graphs of the LC-MS relative abundances of permethylated N-glycan isomers with significant differences (p<0.05) between control and idiopathic RBD cohorts. Symbols: see Figure 2.
Official websites use .gov
A
.gov website belongs to an official
government organization in the United States.
Secure .gov websites use HTTPS
A lock (
) or https:// means you've safely
connected to the .gov website. Share sensitive
information only on official, secure websites.
Bar graphs of the LC-MS relative abundances of permethylated N-glycan isomers with significant differences (p<0.05) between control and idiopathic RBD cohorts. Symbols: see Figure 2.