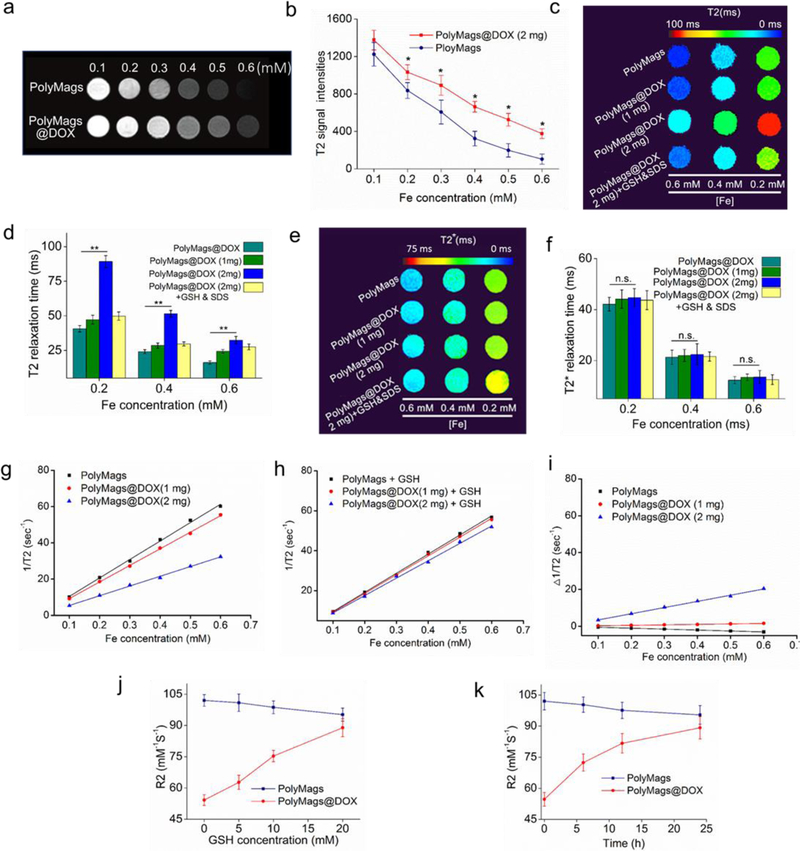
Figure 4.
The T2 MR signal changes accompanied with the payload release and dis-/assembly of the PolyMags@DOX. a) T2 weighted MRI of empty PolyMags and the PolyMags@DOX; c) The T2 weighted MRI of empty PolyMags and PolyMags@DOX at different Fe concentrations. Values reported are mean ± s. d. (n=3). c) T2 map and d) T2 relaxation time of empty PolyMags, PolyMags@DOX (1 mg/mL), PolyMags@DOX (2 mg/mL) and PolyMags@DOX (2 mg/mL) treated with GSH and SDS. e) T2* map and f) T2* relaxation time of empty PolyMags, PolyMags@DOX (1 mg/mL), PolyMags@DOX (2 mg/mL) treated with and without GSH and SDS at different Fe concentrations. g) Initial 1/T2 values measurements of empty PolyMags and PolyMags@DOX. h) 1/T2 values measurements before and after the nanoparticles were disassembled by GSH and SDS. i) Differential 1/T2 relaxation rate values prior to and after incubation with GSH in the presence of SDS. j) GSH concentration-dependent R2 activation of PolyMags@DOX (2 mg/mL) incubated with different concentration GSH from 0 to 20 mM. k) Time-dependent R2 activation of PolyMags@DOX (2 mg/mL) incubated with 20 mM GSH at special time point (0, 6, 12 and 24 h). Statistical analysis was performed with a two-tailed Student’s t-test, ** p<0.01, * p<0.05, n.s. p>0.05.

