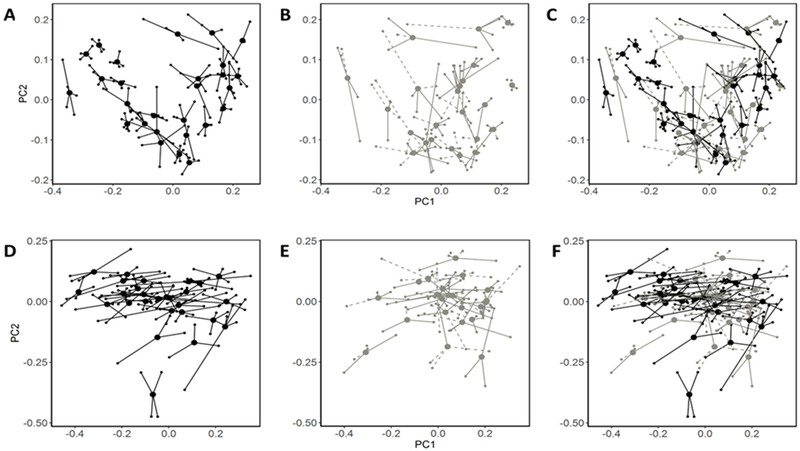
Figure 1.

Variability of the gut microbiome. Principal coordinate plots based on unweighted UniFrac for no antibiotic use (A), antibiotic use (B), all participants (C), and weighted UniFrac for no antibiotic use (D), antibiotic use (E), all participants (F). Smaller dots indicate samples and are connected to larger dots which represent the mean PC1 and PC2 values for each individual. Dashed lines are connected to samples with reported antibiotic use.
