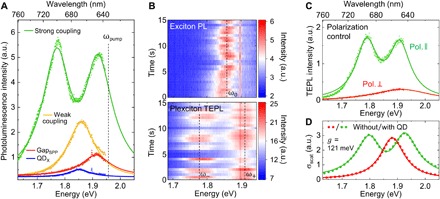
Fig. 2. Tip-enhanced plexciton PL at room temperature in the strong coupling regime.

(A) PL spectra of the gap plasmon (red), QD exciton (blue), the weakly coupled plasmon-exciton mode (orange), and the strongly coupled plexciton mode (green). (B) PL evolution of the uncoupled (top) and the strongly coupled (bottom) single QD. (C) TEPL spectra for a polarization parallel (green) and perpendicular (red) with respect to the tip. (D) FEM simulation of scattering spectra for the plasmonic cavity without QD (red) and with a single QD (green). In (A), (C), and (D), the dots and lines indicate the measurement (or simulation) data and the corresponding model fits, respectively.
