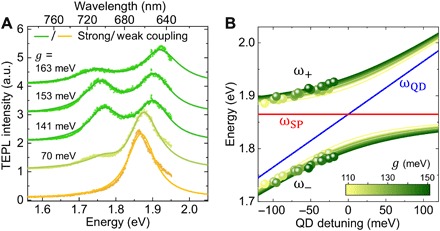
Fig. 3. TESC spectra with increasing coupling strength and plexciton energy diagram with QD detuning.

(A) TEPL spectra of different single QDs with variation in coupling strength g and Rabi frequency. (B) Polariton energies from model fits (circles) and anticrossing curves from model calculations (lines) for each of the measured TEPL spectra of 21 different QDs. The expected surface plasmon (red) and QD (blue) detuning dependence is obtained from averaged values from the modeled 21 spectra.
