Figure 1.

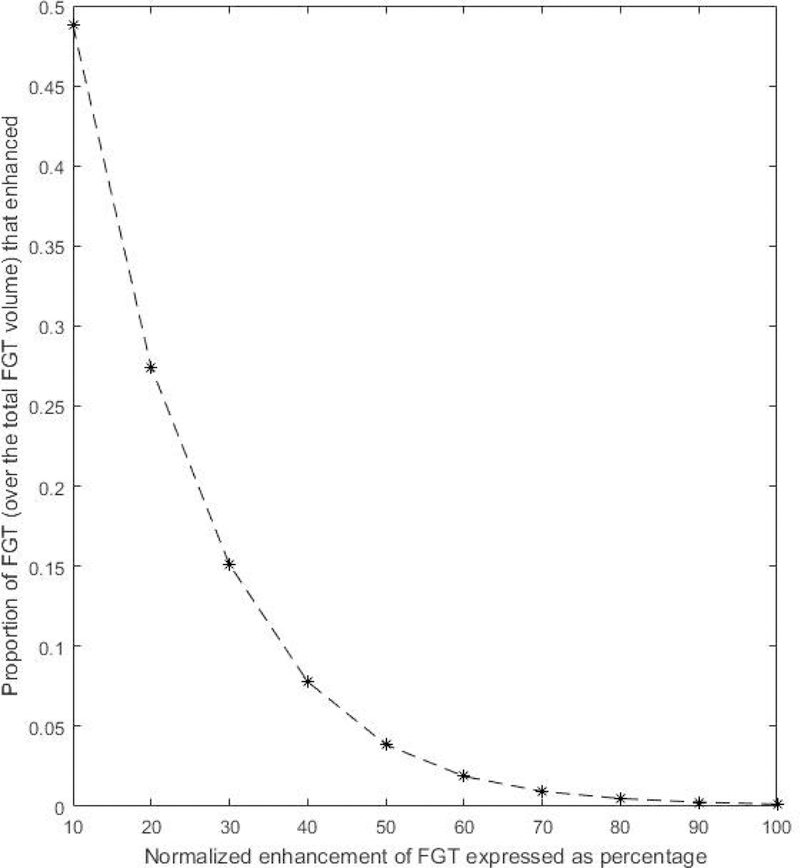
A curve showing the proportion of FGT voxels (over the total FGT volume) that has a normalized enhancement of T% or more. T ranges from 10 to 100 with intervals of 10.

A curve showing the proportion of FGT voxels (over the total FGT volume) that has a normalized enhancement of T% or more. T ranges from 10 to 100 with intervals of 10.