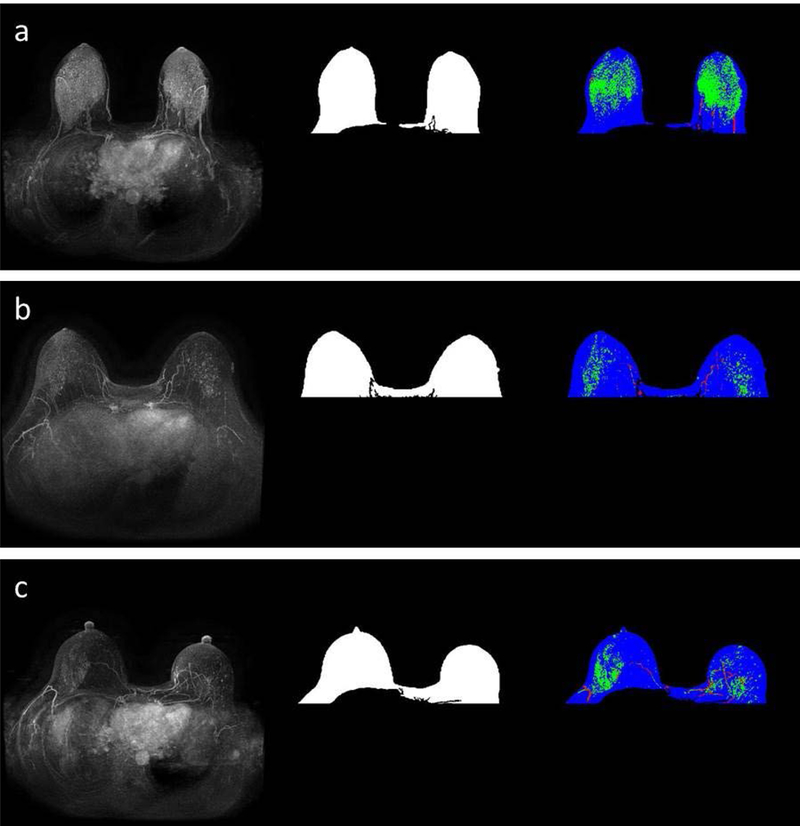
Figure 2.

Images from a patient that subsequently developed cancer (a) and the two matched controls (b and c respectively). The MIPs are presented in the first column and the breast masks are shown in the second column. The third column represented enhanced FGT on the MIP in green, vessels in red and remaining breast mask in blue. The FGT for these images was extracted from the corresponding T1 non-fat saturated sequence.
