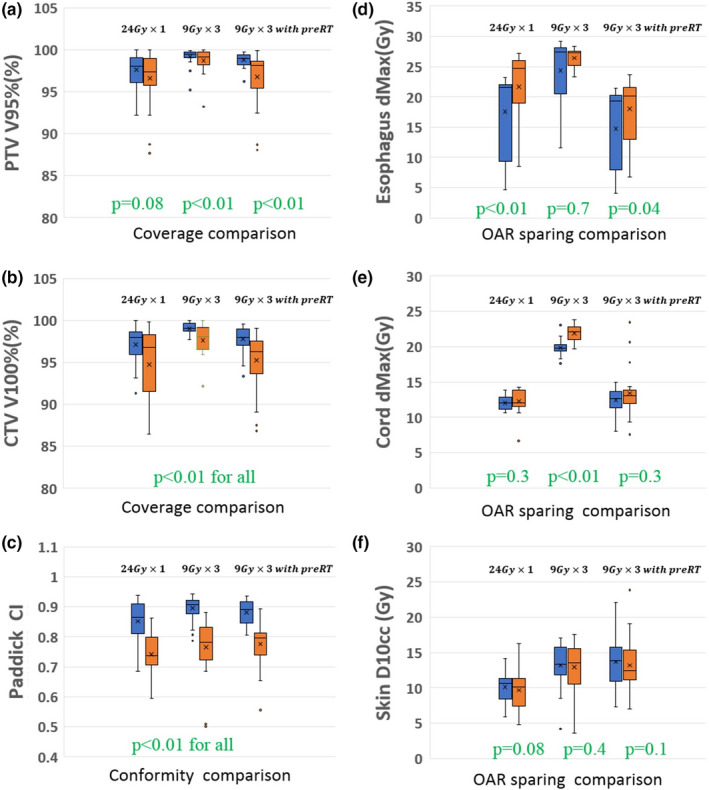
Figure 4.

Comparison of the automated ECHO plans (blue bars, left) and the manually created plans (orange bars, right) for 75 SBRT paraspinal plans with three different prescription/fractionation schemes (25 plans per scheme). The higher the value the better for the coverage and conformity comparisons in the left plots, and the lower the value the better for the OAR sparing comparisons in the right plots. For statistical tests, Wilcoxon signed‐rank test was used and P = 0.05 was considered as statistical significance. [Color figure can be viewed at wileyonlinelibrary.com]
