
Figure 4.
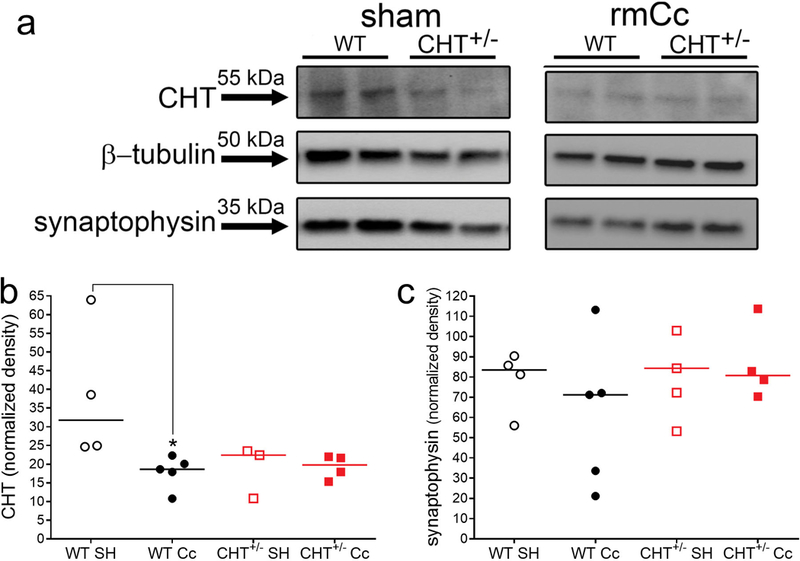
Immunoblot analysis of cortical CHT and synaptophysin protein levels in WT and CHT+/− mice following SH or rmCc. a Immunoblots showed the expectedly reduced total CHT levels in CHT+/− mice when compared to levels in WT SH mice (the two bands per group and condition indicate data from two mice each). Furthermore, the rmCc-induced decrease in CHT levels in WT mice is apparent. These examples also indicate that synaptophysin levels did not differ between the phenotypes and SH versus rmCc. b and c depict normalized, integrated CHT and synaptophysin levels, respectively (*, P<0.05, based on Kruskal Wallis test and multiple non-parametric comparisons; the genotype effect in SH mice failed to reach significance; P=0.057).