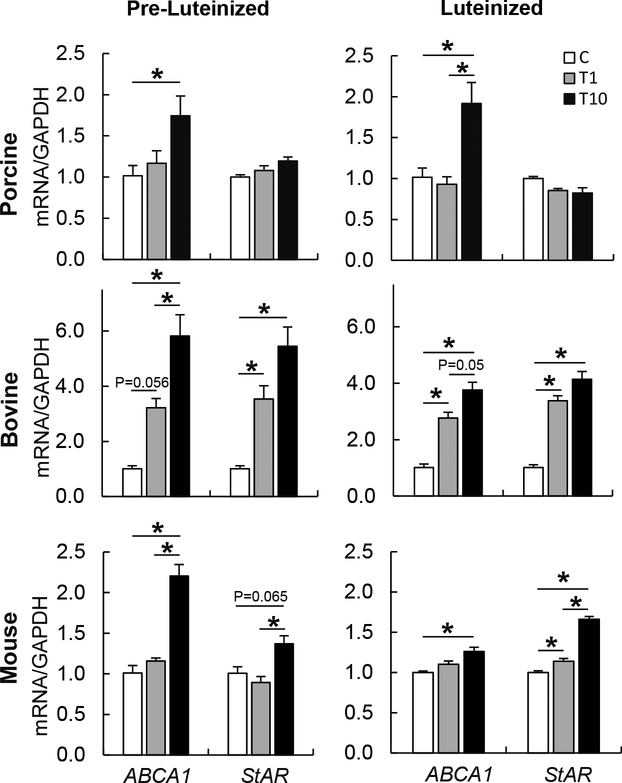
Figure 6.
Effect of TBT exposure on mRNA expression (mean ± SEM) of cholesterol transporters (ABCA1 and StAR) in pre-luteinized (left) and luteinized (right) porcine (top), bovine (middle), and mouse (bottom) primary theca cells exposed to 1 ng/ml TBT (gray bars), 10 ng/ml TBT (closed bars) or vehicle (control group; open bars). Asterisks denote differences among treatments (P < 0.05). One primary cultured cell line per species was used.

