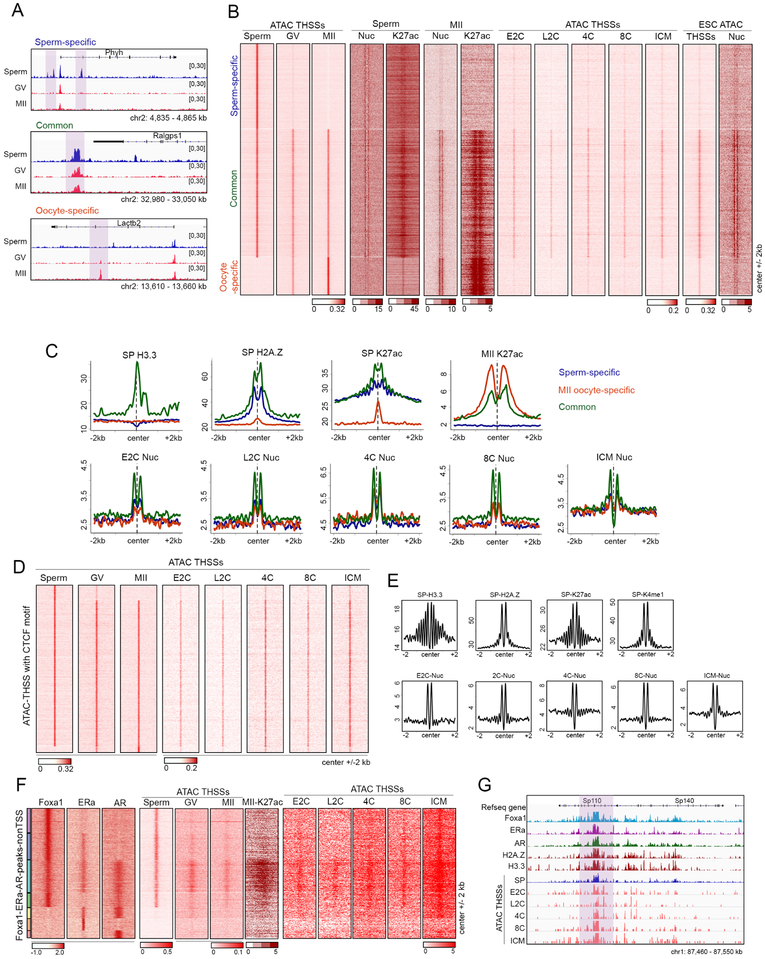
Figure 6. Chromatin accessibility at regulatory regions in gametes and pre-implantation embryos.
(A) Track view of distal ATAC-seq THSSs in sperm, GV, and MII oocytes at allele-specific or common accessible distal regulatory regions (highlighted).
(B) Heatmaps comparing distal ATAC-seq THSSs and nucleosomes between sperm, oocytes, and pre-implantation embryos. Also shown is the distribution of H3K27ac ChIP-seq signal in sperm and MII oocytes, and ATAC-seq THSSs in preimplantation embryos and ESCs. Clusters were derived by k-means clustering of sperm and oocytes ATAC-seq THSS reads.
(C) Average profiles of ChIP-seq signal for histone variants H3.3 and H2A.Z in sperm, and H3K27ac in sperm and MII oocytes at the same distal regulatory regions as in Figure 6B. Lower panels show average plots of ATAC-seq nucleosome signals from preimplantation embryos.
(D) Heatmap showing ATAC-seq THSSs from sperm, GV and MII oocytes, and preimplantation embryos at all distal regulatory regions containing the CTCF motif.
(E) Average profiles of ChIP-seq signal for histone variants H3.3 and H2A.Z in sperm, and H327ac in sperm and MII oocytes, at the same distal regulatory regions as in Figure 6D. Average plots of ATAC-seq nucleosome signals from preimplantation embryos are also shown.
(F) K-means clustering of Foxa1, ERα, and AR ChIP-seq signal at distal THSSs overlapping a peak for at least one of these three proteins. ATAC-seq THSS signal from sperm, GV and MII oocytes, and preimplantation embryos is shown at the same clusters.
(G) Track view of a specific genomic region showing maintenance of accessibility at Foxa1 sites in sperm during embryo development.
See also Figure S6

