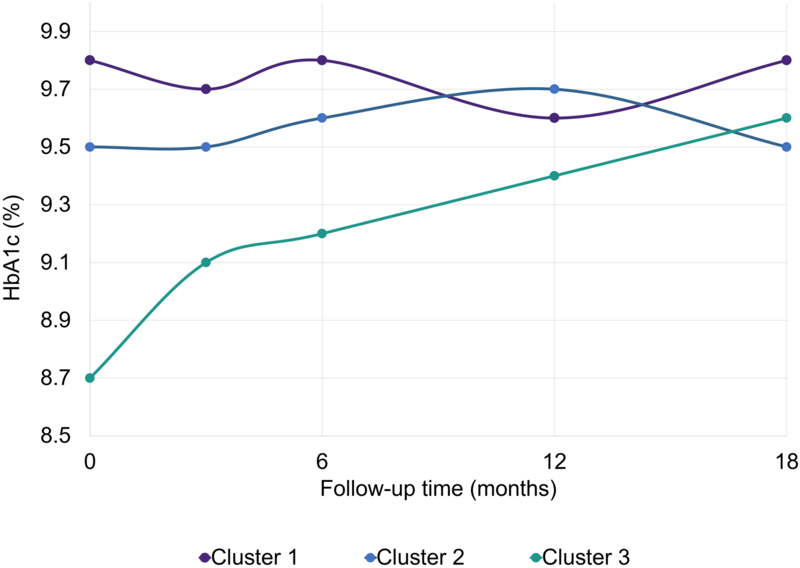
Figure 2: Longitudinal Hemoglobin A1c (HbA1c) outcomes of FLEX Participants by Dysglycemia Cluster, adjusted for FLEX study site and randomization assignment (p-for-interaction = 0.006).

The p-for-interaction represents Type 3 Test of Fixed Effects for time point × cluster interaction term. Missing data— Baseline: n=0; 3-month HbA1c: n= 10; 6-month HbA1c: n= 14; 12-month HbA1c: n=20; 18-month HbA1c: n=16. p-values for each cluster*timepoint estimate (Cluster 1 vs Cluster 2, Cluster 1 vs Cluster 3): Baseline (p=0.89, p<0.0001); 3-month (p=0.23, p=0.08); 6-month (p=0.49, p=0.14), 18-month (p=0.03, p=0.85). Abbreviations: HbA1c – hemoglobin A1c.
