
FIGURE 1.
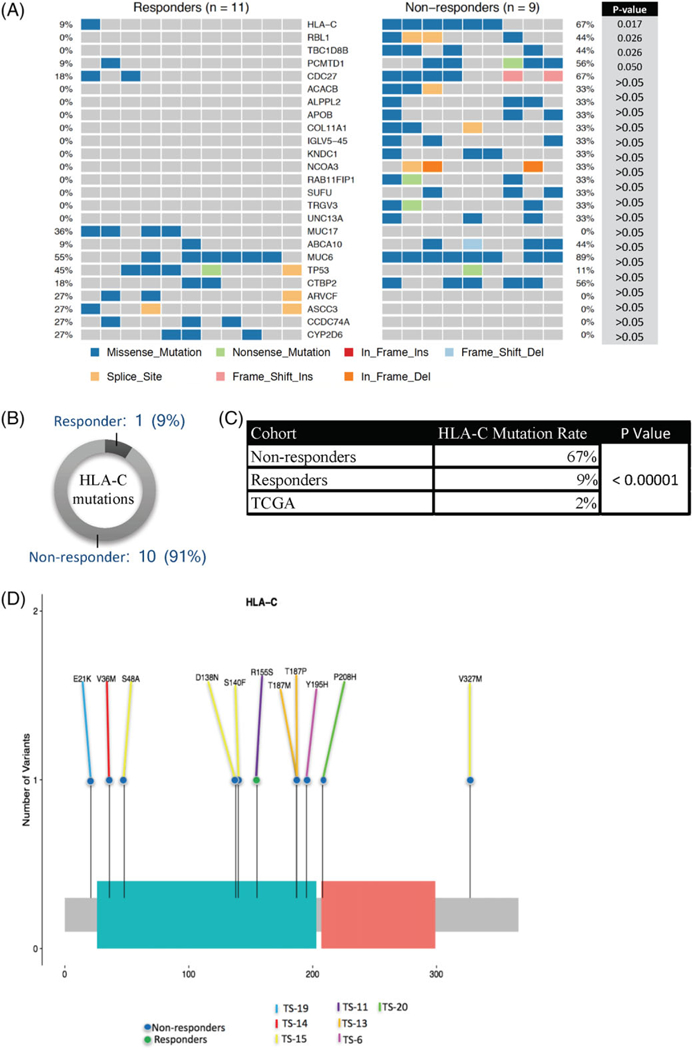
HLA-C mutations are over-represented in nonresponders to cetuximab. A, Most differentially mutated genes between responders and nonresponders by Fishers exact test. Percentages represent the percent of tumors within the cohort that possess a potentially deleterious mutation within a given gene. B, Graphical representation of total HLA-C mutations within each cohort. C, Comparison of HLA-C mutation rates among responders, nonresponders, and TCGA by x2 test. D, Lollipop plot demonstrating distribution of mutations within HLA-C. Colored lines correspond to sample, and colored dots correspond to responder/nonresponder category. Abbreviations: HLA-C, human leukocyte antigen-C; TCGA, The Cancer Genome Atlas [Color figure can be viewed at wileyonlinelibrary.com]