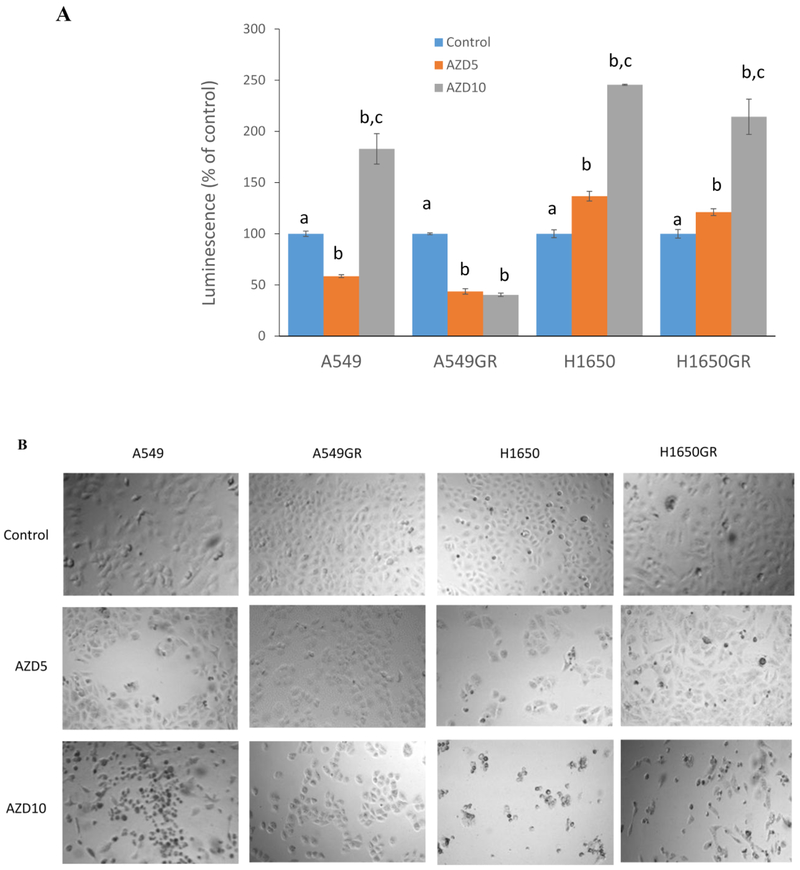
Figure 2. Caspase 3/7 activities and morphological changes in A549, A549GR, H1650, and H1650GR after AZD9291 treatment at 5 μM (AZD5) and 10 μM (AZD10) for 48 hrs.
(A) Normalized luminescence readings of A549, A549GR, H1650, and H1650GR are compared to the control. Data are means ± SD, n = 3. Mean values of the same cell line containing different letters indicates a significant difference among the treatment groups analyzed by a one-way ANOVA followed by a Fisher's LSD test (p<0.05). Values bearing the letter “a” indicate no significant differences compared with control, those labeled “b” denote a significant difference when compared with the control, and “c” denotes a significant difference when is AZD10 compared with AZD5. (B) Microscopic images (×40) of A549, A540GR, H1650, and H1650G after 5 μM and 10 μM AZD9291 treatments.

