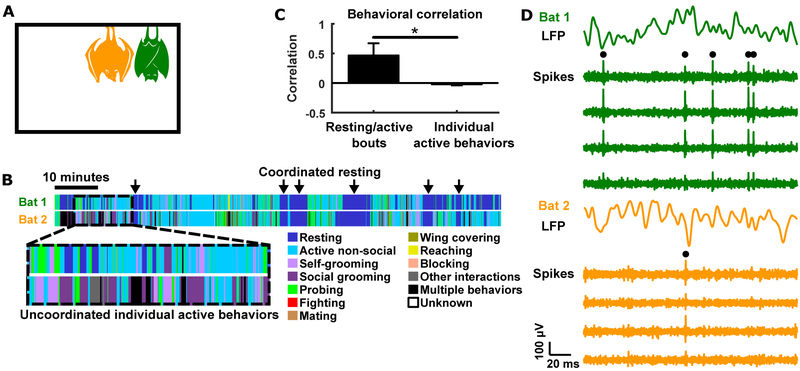
Figure 1. Experimental setup and behavior.
(A) Neural activity was wirelessly recorded simultaneously from pairs of bats that freely behaved and interacted in a chamber.
(B) Behavior of a pair of bats during one example session, as manually annotated frame-by-frame from the video recording. Resting tends to be coordinated between the bats (arrows), while individual active behaviors tend to be uncoordinated (dashed box).
(C) Quantification of behavioral correlation across bats (mean ± STD across sessions; see STAR Methods). Bouts of resting and active behaviors were correlated between bats, whereas individual active behaviors were not. *, p<0.05, Wilcoxon rank sum test.
(D) Example voltages traces intracranially recorded simultaneously on two tetrodes, each from a different bat. For each bat, the top trace is LFP, and the bottom traces show spiking activity from the four channels of a tetrode. Black dots highlight spikes for isolated single units.

