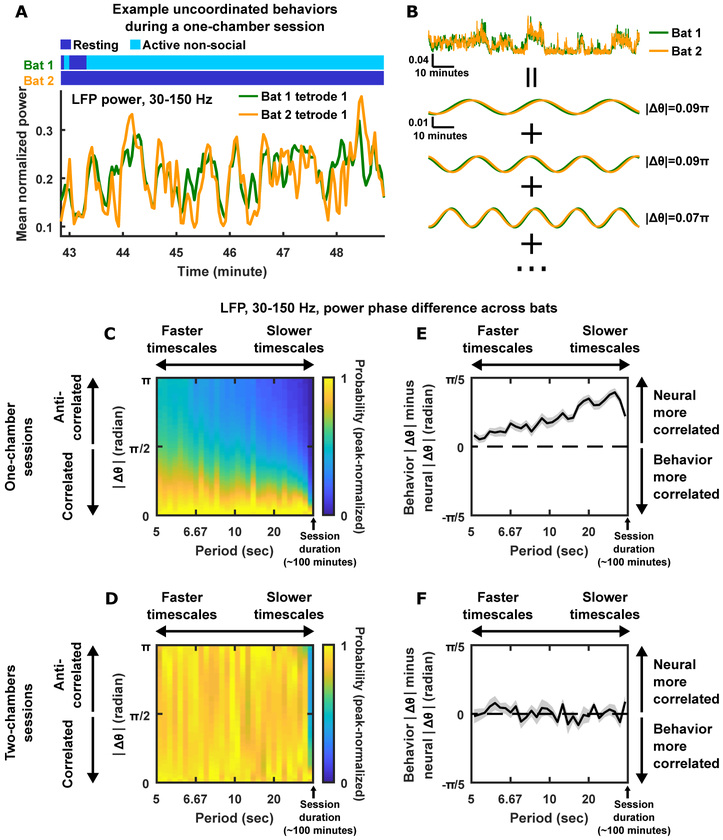
Figure 6. Neural correlation across brains over a wide range of timescales, above and beyond behavioral correlation.
(A) Mean normalized LFP power in the high frequency band simultaneously recorded from two bats when one of them was resting and the other was mostly active. Note the high degree of correlation between the two bats despite their very different behaviors.
(B) Analyzing phase difference. Example traces of mean normalized LFP power from two bats (top; scale bars denote mean normalized power and time) are decomposed into sums of sine waves at different timescales (bottom; scale bars are shared between the three pairs of sine waves). |Δθ|, the absolute value of the phase difference between a pair of sine waves, is indicated. The more correlated the LFP power traces are at a given timescale, the smaller |Δθ| is at that timescale.
(C) Distributions of |Δθ| as a function of timescale for one-chamber sessions (STAR Methods). The x-axis is the period of the sine waves into which the neural signals were decomposed (as shown in B); smaller periods correspond to faster timescales, with the maximum period being the session duration of ~100 minutes. Each vertical “slice” of the plot is a distribution of |Δθ| at a given timescale, computed over all pairs of channels, all pairs of bats, and all one-chamber sessions. Each distribution (i.e. each vertical slice) was individually peak-normalized for visualization, where the peak-normalized probability is indicated by color. Note that across the entire range of timescales, the distributions are peaked near a |Δθ| of 0, indicating that correlation across brains extended over the entire range of timescales, from seconds to hours.
(D) Same as (C) but for two-chambers sessions. Note that at most timescales, |Δθ| was randomly distributed, indicating the absence of correlation on two-chambers sessions.
(E-F) |Δθ| was calculated for binary time series of resting/active behaviors and compared with neural |Δθ| (STAR Methods). (E) Behavior |Δθ| minus neural |Δθ|, as a function of timescales, averaged across all one-chamber sessions. Shading indicates SEM. Note that the curve is positive throughout the entire range of timescales, indicating that neural correlation is above and beyond the behavioral correlation of resting/active bouts at these timescales. (F) Same as (E) but for two-chambers sessions. Note that for the two-chambers sessions, neural correlation was comparable to the behavioral correlation of resting/active bouts, suggesting that the neural correlations were largely a reflection of the behavioral correlation of resting/active bouts.
See also Figure S6.

