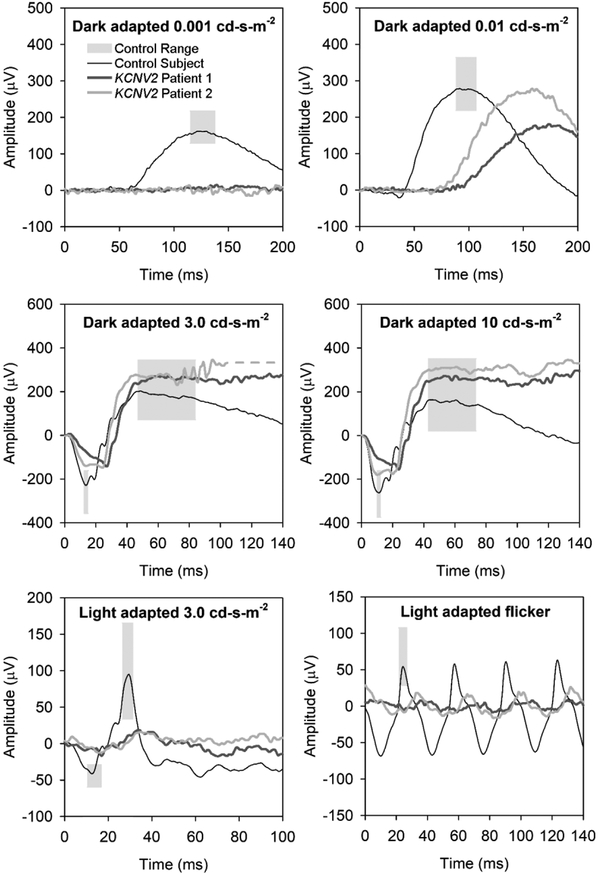
Figure 1.
Full-field electroretinogram in KCNV2 retinopathy patient 1 (dark gray traces) and 2 (medium gray traces). A representative control trace is shown in black, and light gray boxes represent the a- and b-wave control ranges for amplitude and implicit time (time to peak amplitude). The dark-adapted rod-isolated responses are shown in the top two panels, with a very dim flash (0.001 cd-s-m−2) response in the upper left panel and the ISCEV-standard rod-isolated stimulus (0.01 cd-s-m−2) in the upper right panel. The middle panels show dark-adapted ISCEV-standard combined (rod and cone) responses, with the 3.0 cd-s-m−2 response in the middle left and the 10.0 “maximal” response in the middle-right panel. The ISCEV standard light-adapted cone-isolated responses are shown in the bottom panels, with the 3.0 cd-s-m−2 single-flash response in the lower left panel and the 30-Hz flicker in the lower right panel.

