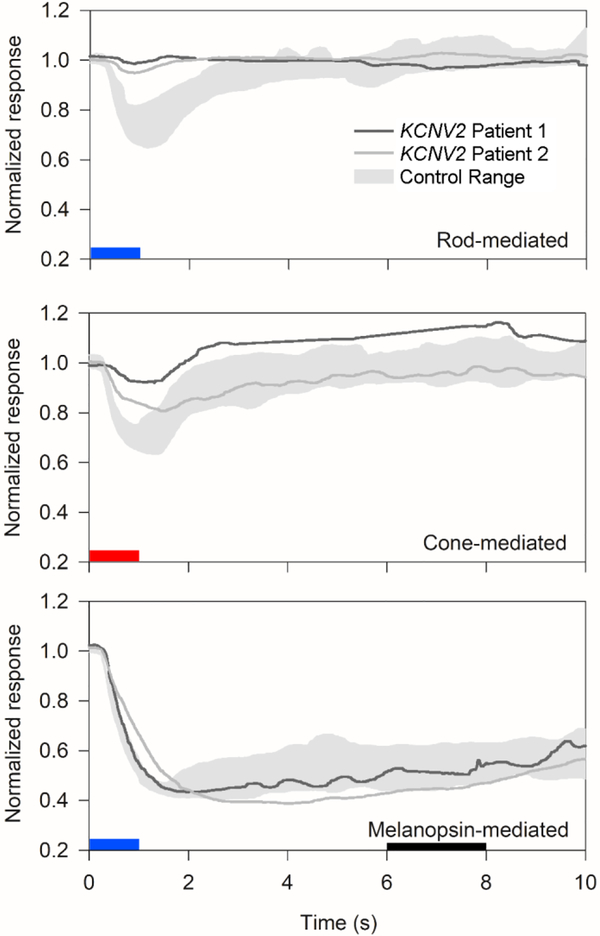
Figure 2.
Pupillary light reflex to rod-, cone-, and melanopsin-mediated stimuli. As in Figure 1, dark gray traces represent patient 1, medium gray traces represent patient 2, and light gray zones represent control range for each stimulus. The pupillary light reflex is plotted as a proportion of baseline pupillary diameter (y-axis) versus time after onset of a 1-second full-field stimulus, represented by blue (for short-wavelength stimulus) or red (for long-wavelength stimulus) boxes. The top panel shows the rod-isolated transient response to a dim short-wavelength stimulus. The middle panel shows the nominally cone-isolated response to a long-wavelength stimulus on a rod-suppressing short-wavelength background light. The bottom panel shows the melanopsin-mediated sustained response, measured at 5–7 seconds after stimulus offset (represented by a black box).

