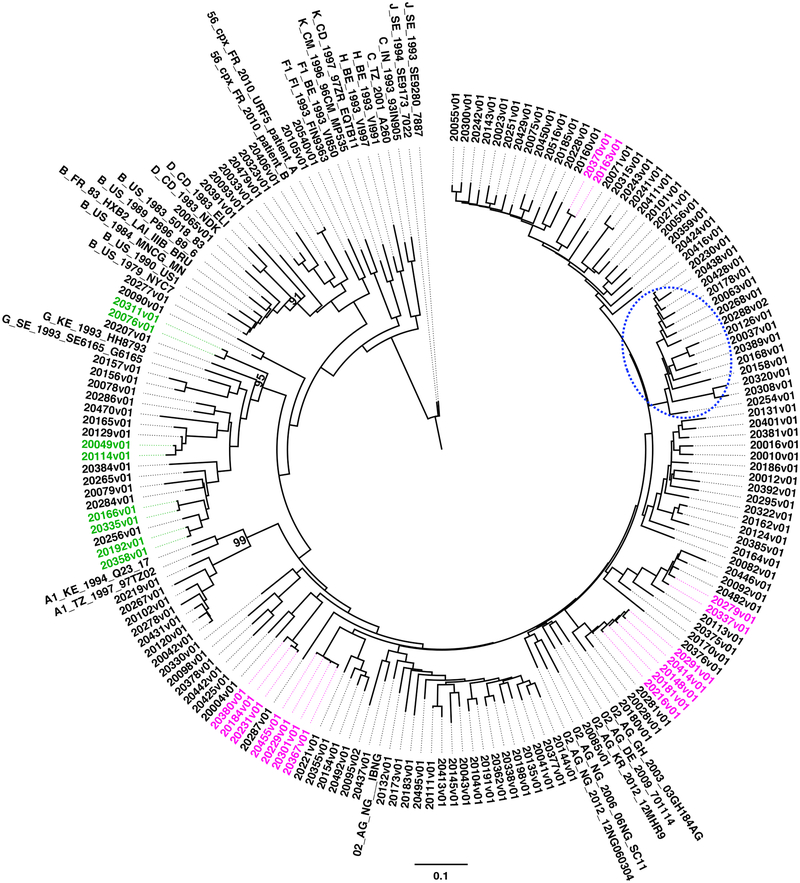
Figure 1.
Phylogenetic relationships and transmission network clusters among participant pol sequences. Maximum likelihood (ML) tree constructed using subtype reference strains and pol sequences (HXB2: 2273–3869) from prevalent infections observed at study enrollment. Colored sample numbers denote CRF02_AG (pink) or subtype G (green) sequences belonging to proposed transmission networks (defined as having a pairwise genetic distance ≤1.5%). The cluster circled in blue represents the CRF02_AG/B recombinants in which the CRF95_02B strains were observed. ML bootstrap values at relevant nodes are shown. The scale bar indicates a genetic distance of 10%.

