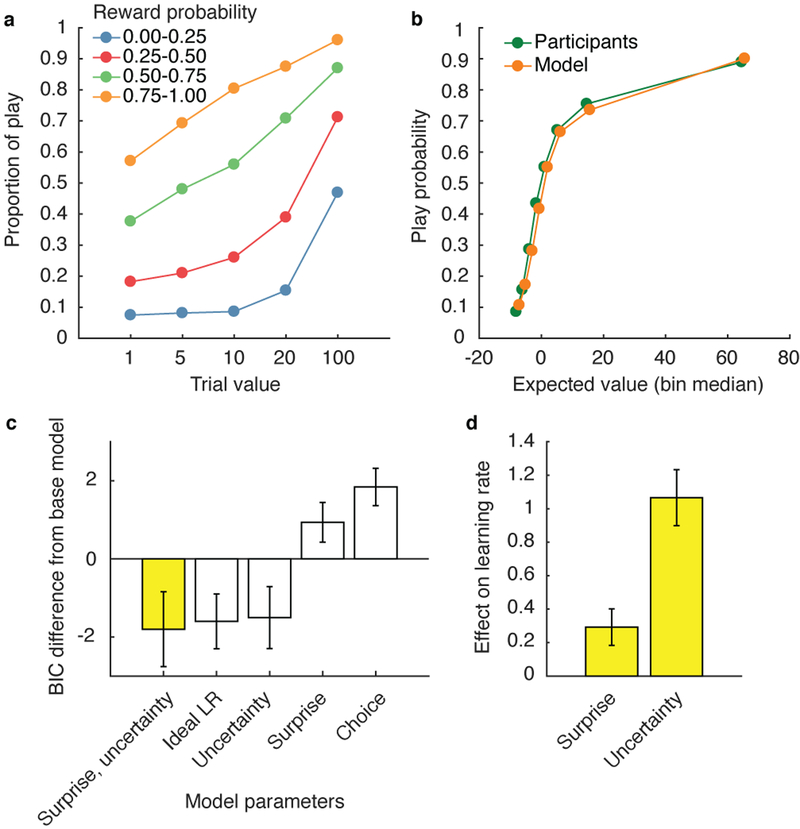
Figure 2.
Participants’ behavior indicates an integration of reward value and subjective reward probability estimates, which were updated as a function of surprise and uncertainty (N = 199). a, Proportion of trials in which the participants chose to play, broken down by reward value and reward probability. b, Participant choice behavior and model-predicted choice behavior. The model with the lowest Bayesian information criterion (BIC), which incorporated the effects of surprise and uncertainty on learning rate, was used to generate model behavior (yellow bars in c, d). Expected rewards for all trials were divided into 8 equally sized bins for both participant and model-predicted behavior. c, BIC of five reinforcement learning models with different parameters that affect learning rate. d, Mean maximum likelihood estimates of surprise and uncertainty parameters of the best fitting model (first bar in c). Error bars indicate standard error across participants.

