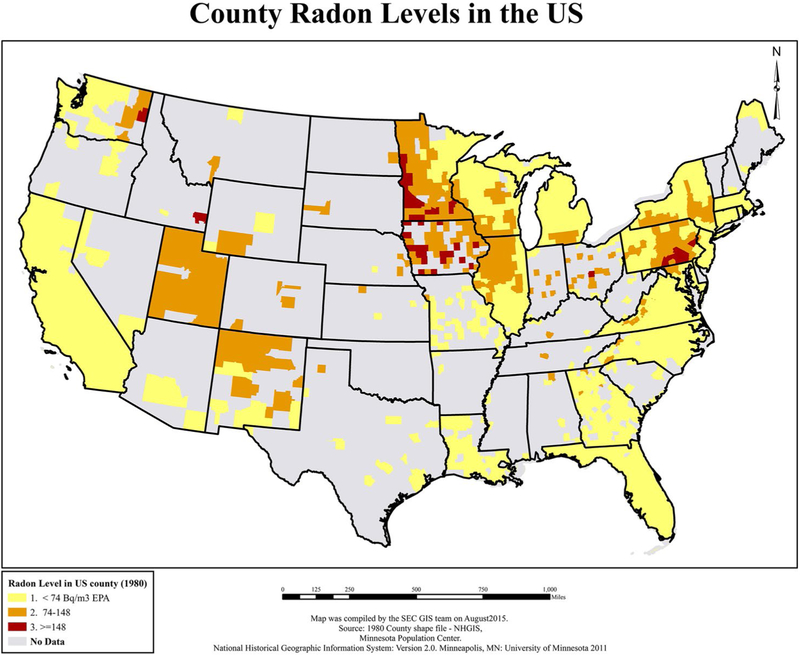
Figure 2.
Radon levels are illustrated according to 1982 US county of residence from the Cancer Prevention Study-II. EPA indicates Environmental Protection Agency; GIS, geographic information systems; NHGIS, National Historical Geographic Information Systems; SEC, Statistics and Evaluation Center. Reprinted from: Teras LR, Diver WR, Turner MC, et al. Residential radon exposure and risk of incident hematologic malignancies in the Cancer Prevention Study-II nutrition cohort. Environ Res. 2016;148:46–54, with permission from Elsevier.87

